
Cognos Analytics
The Joy of Custom Controls in Cognos Reports Version 11.1.X
Here’s how to toggle between hiding and showing parts of a report Custom Controls, a new capability with release eleven, easily enables the report author to add Java Script to the report, thus providing an enhanced user experience when rendering the data in HTML. As long as the report is running in full interactive mode,…
Adding a Table of Contents in Cognos Reports Version 11.1.X
Don’t hunt and peck for your piece of the report, use a table of contents! A table of contents, sometimes headed as Contents or abbreviated informally as TOC, is a list usually found on the first page of a report. It includes section titles or brief descriptions with their corresponding page numbers. When running a…
Layout Component References in Cognos Reports Version 11.1.X
How to use a Layout Component Reference, and override components when necessary! One of the main struggles report authors face is the maintenance of production reports. It’s not enough to just create the report, one must also ensure the report is updated as changes are made to corporate privacy notifications, colors and logos. This is…
What Can a List Header and Footer Do for you in Cognos Analytics 11+
What Can a List Header and Footer Do for you in Cognos Analytics 11+ Just make your report look and read great! I recently had a client who wanted to see summary cost information on Sales Orders at the header of the page, with details available in a list report. I tried using singleton’s and…
Adding an Overall Header and Footer in Cognos Analytics Report 11.0+
Use an overall footer to add a high-level summary data set to the end of your report. Unlike a “List Page Header and Footer” which appears at the top or bottom of every page respectively in which list data appears, an “Overall Header and Footer” only appears once at the top or bottom of the…
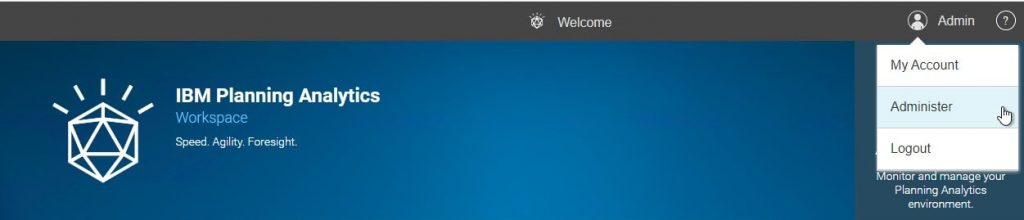
Linking a website URL to my Cognos Analytics 11.0.4+ Welcome Page
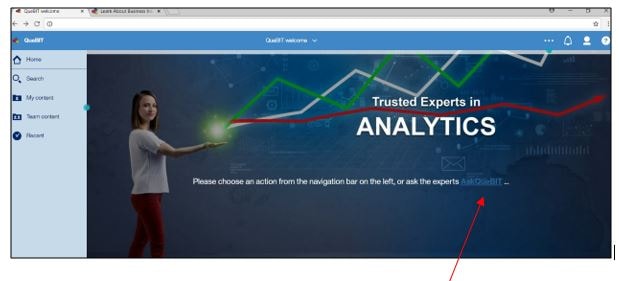
Wow, now I can add a URL link to my Cognos Analytics (CA) Welcome Page! Business Case: In an earlier QueBIT Knowledge Base article, “Setting a Default Welcome Page in Cognos Analytics 11.0.4+”, you learned how to set up a custom welcome page in CA. In this article, we are going to add a URL…
Creating a Simple Dashboard in Cognos Analytics 11.0.0+
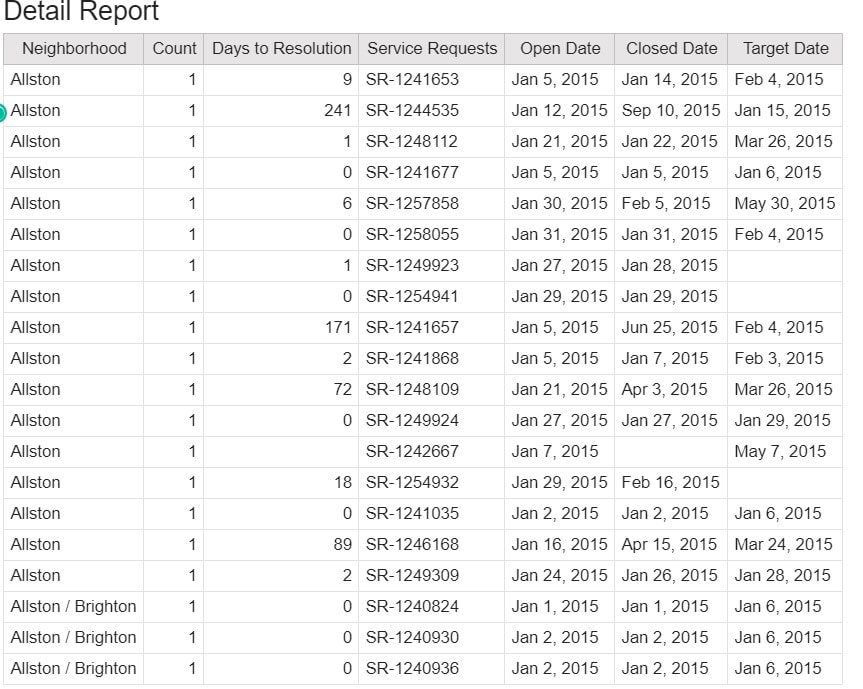
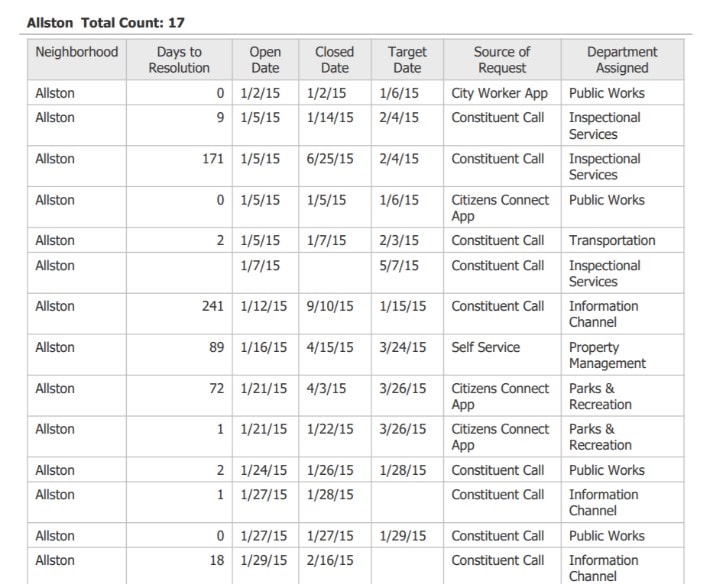
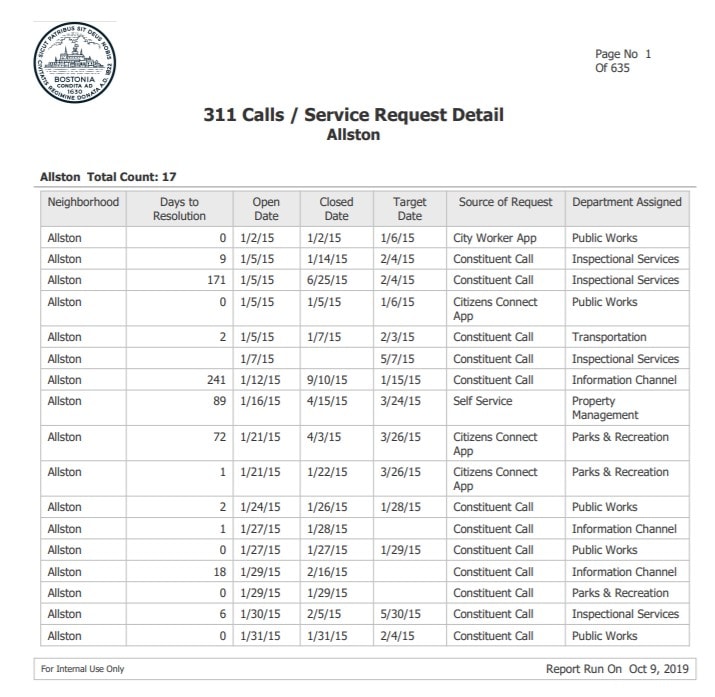
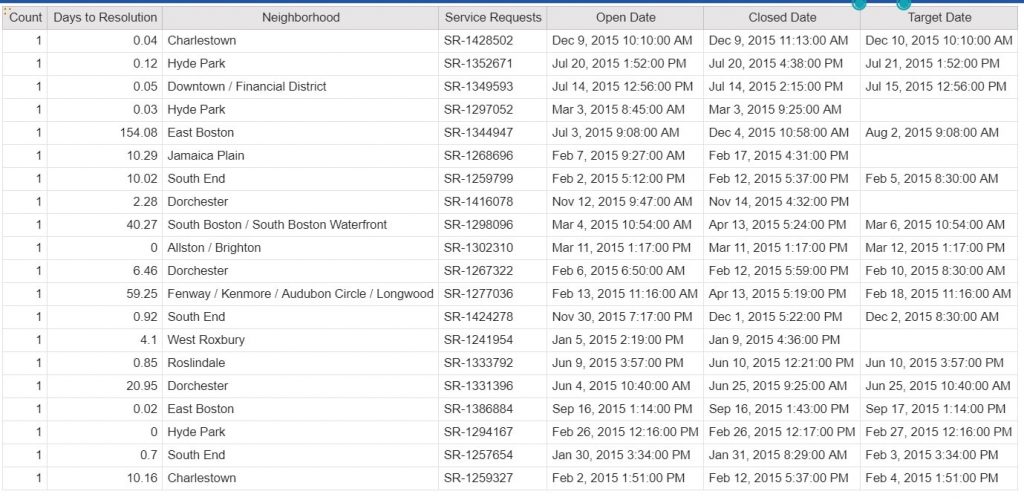
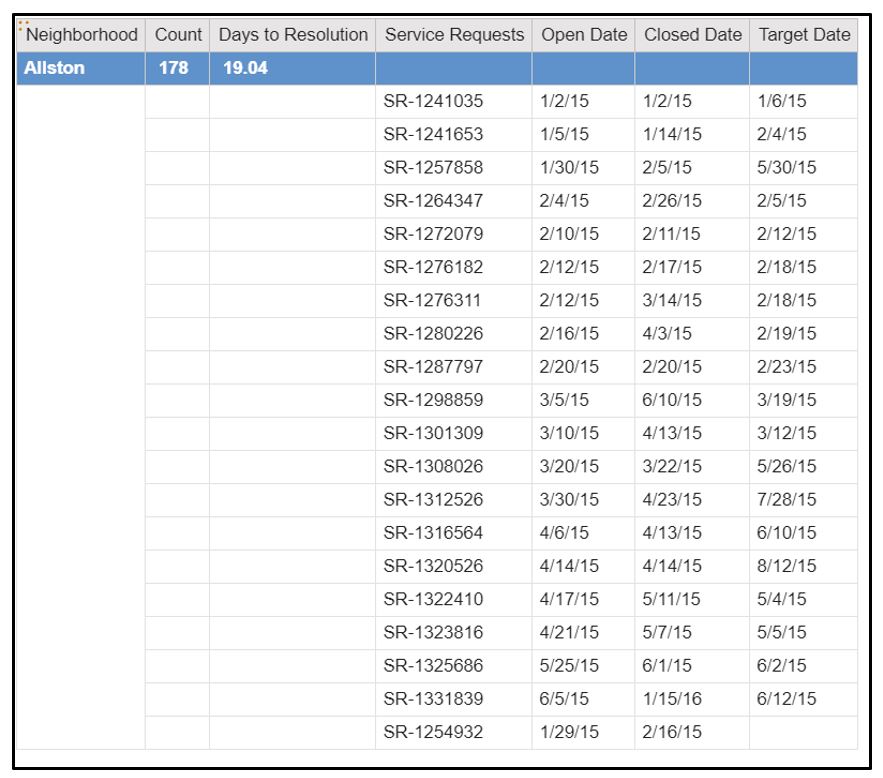
Let’s get started with Dashboard basics… It’s easy! Business Case: The City of Boston currently utilizes a “311 System”, which enables city residents or city workers to easily report non-emergency issues. Items such as broken streetlights or graffiti can be reported to the proper city services department via mobile phone applications, online, social media or…
Interactive Dashboards in Cognos Analytics 11.0.0+
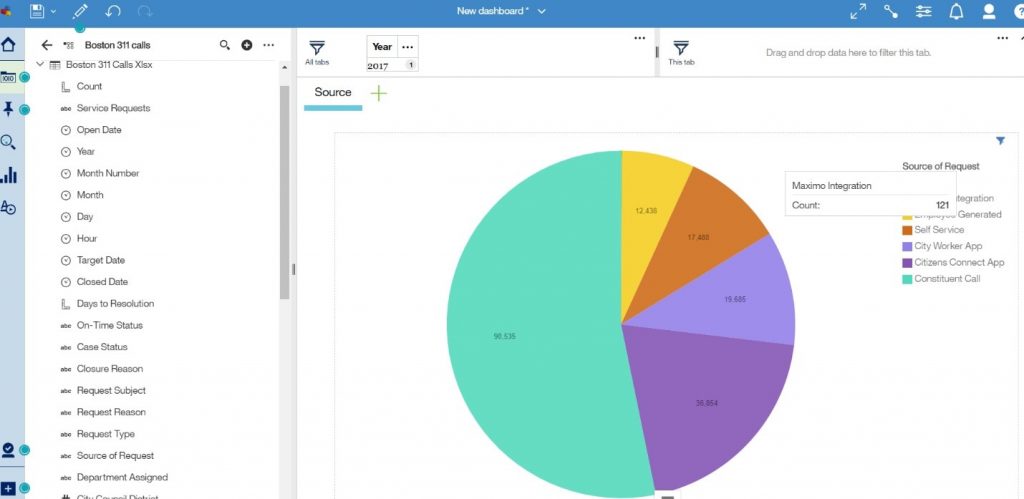
Let’s add additional visualizations and create an interactive workspace. In my last knowledge base article, “Creating a Simple Dashboard in Cognos Analytics 11.0.0+”, I covered how to easily create a single visualization depicting a key performance indicator (KPI). Taking this a step further, this article will show you how to add multiple visualizations to create…

Drill Through from a Dashboard! Cognos Analytics 11.0.10+
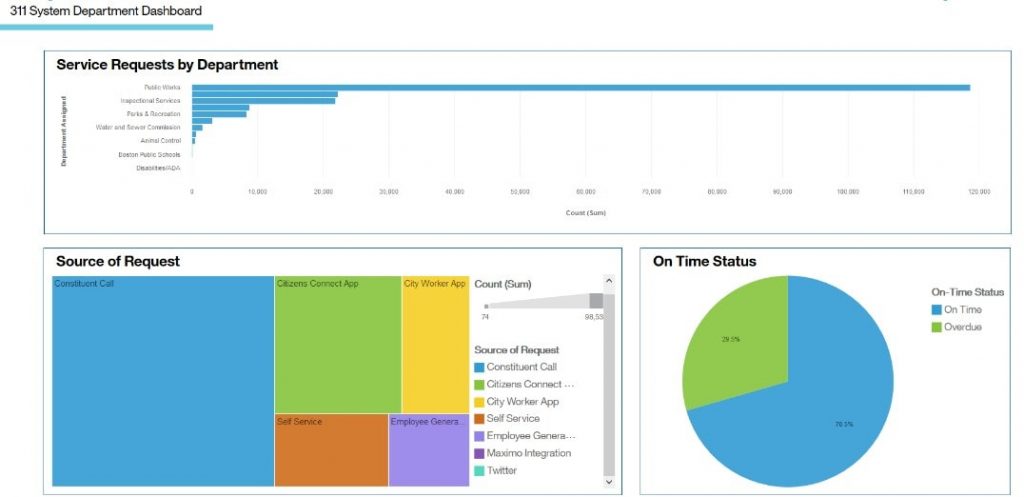
You’re kidding, I can now drill through to a report from a dashboard! One of the most popular Cognos Analytics (CA) enhancement requests across all of IBM has been the ability to drill from a Dashboard to a Report. Well, it can now be done. It is an easy task to author a drill-through that…
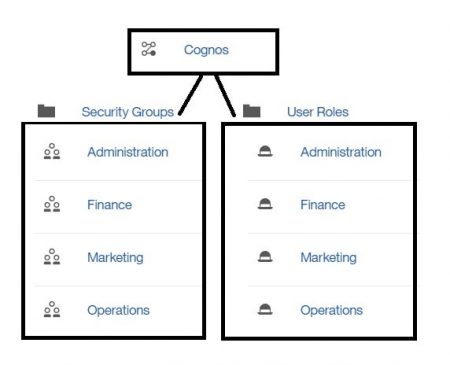
Utilizing Groups and Roles with Security in Cognos Analytics 11.0.XX
Business Case: One key to an easily managed security structure and tailored data portal in IBM Cognos Analytics is to utilize groups and roles. If you are using the roles that are predefined or created in the Cognos namespace, you can customize themes, home pages, and report parameters that are unique to each function area. …

IBM Cognos Analytics Story Templates
The new IBM Cognos Analytics Story templates allow business analytics professionals to tell their businesses’ stories by combining Cognos data with pictures, video, charts, graphs, and prompts in a slide based, guided experience that dynamically, intuitively and automatically leads an audience through a tailored presentation.
Planning Analytics
Planning Analytics and Transaction Log Management
Planning Analytics and Transaction Log Management If you are responsible for administrating IBM Planning Analytics, then the transaction log most likely has been queried regularly in an attempt to identify data changes (for example date and time of a change and name of the client that made the change) and – most Likely – the…
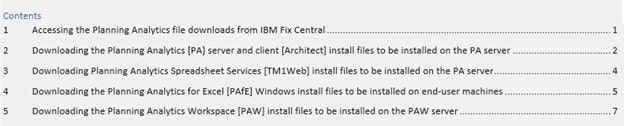
Demystifying the PA / PAfE / PAW / PASSL Install Files from IBM Fix Central
Finding the correct Planning Analytics download files from IBM Fix Central can be a confusing task. This guide will walk you through the steps necessary to identify the Planning Analytics [PA], Planning Analytics for Excel [PAfE], Planning Analytics Workspace [PAW], and Planning Analytics Spreadsheet Services [PASSL] files that you need for your system. 1 –…
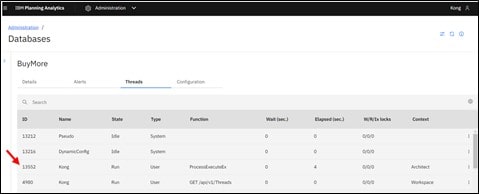
Using Multiple Architect Sessions for Development and Testing
Did you know that the Planning Analytics Architect desktop client allows for multiple instances to run simultaneously? This feature can be used to greatly improve efficiency during development, testing, and even day to day use. When to use multiple architect sessions? Long running processes can lock an Architect or Perspectives session until the process finishes.…
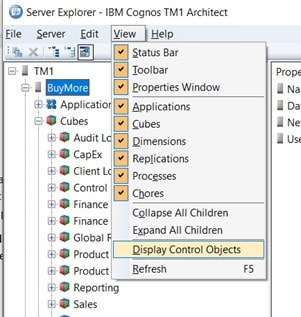
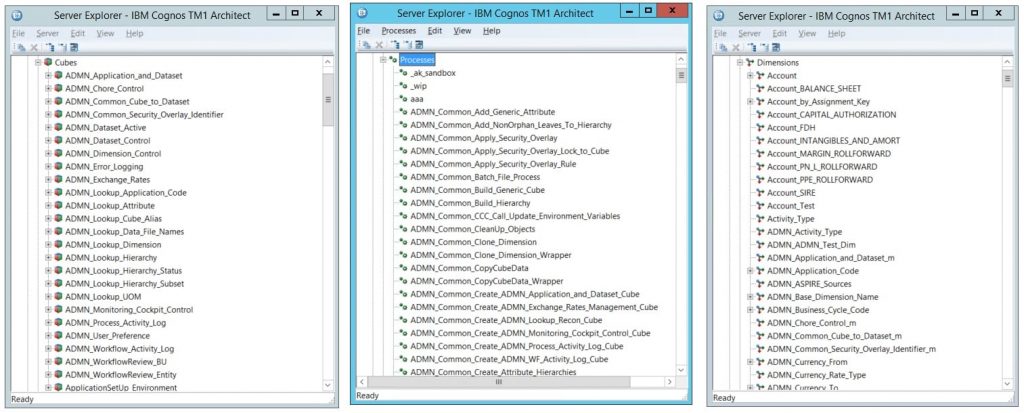
IBM Planning Analytics: Control Objects – what are they and how to view them
Control objects are system-generated objects in Planning Analytics that can help perform tasks such as administer security, record attributes, and record performance statistics (if performance monitor is on). These will include cubes, processes, and dimensions that are all prefixed with the symbol }. Types of Control Objects Security Control Cubes There are several security control…
Using Conditional Formatting & Calculations with IBM Planning Analytics Workspace
IBM Planning Analytics Workspace (PAW) is a web-based interface for IBM Planning Analytics. It delivers an interface to the data in planning analytics (TM1), providing ways to plan, create, and analyze your content by providing features such as conditional formatting and calculations. Conditional formatting is a feature in many spreadsheet applications that allows you to apply specific formatting to cells that…
Loading Data into a Cube using IBM Planning Analytics Workspace
IBM Planning Analytics stores data that you need for your planning, analysis, and other reporting in multidimensional cubes. Each cube typically has a specific purpose. A cube must have at least two dimensions. The number of dimensions that there are in a cube depends on the purpose of the cube. Loading a Cube Once you…
IBM Planning Analytics and PGP
Pretty Good Privacy (PGP) is an encryption program that provides cryptographic privacy and authentication for data communications. PGP is used for signing, encrypting, and decrypting texts, e-mails, files, directories, and whole disk partitions and to increase the security of e-mail communications. When you send a message using PGP, the message is converted into unreadable ciphertext on your device before it passes over the Internet. Only the recipient…
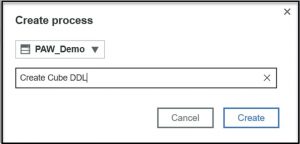
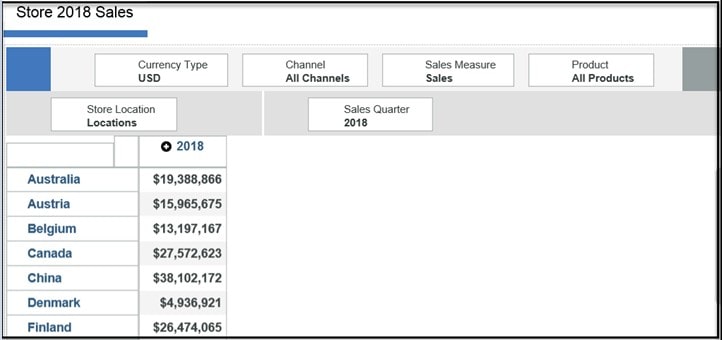
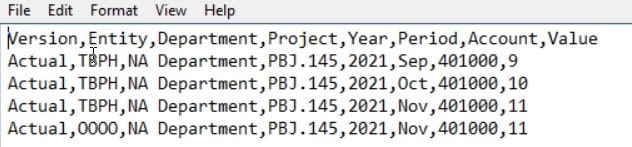
A Database Administrator Approach to Building Cubes in IBM Planning Analytics Workspace
If you are more of a code-junkie at heart like me, or perhaps have come from a relational database background, you may want to think about the following concept. By now, you most likely understand how to build cubes using Planning Analytics Workspace (PAW). If not, you can have a look here. Similar to TM1…
Planning Analytics Workspace Security
Security for Planning Analytics Workspace (PAW) consists of three main parts: users, groups, and roles. It is important to realize that these three objects are PAW specific and just give access to PAW objects (books/views/dimension editors etc.) and these users will need to be set up in the Planning Analytics (PA or TM1) side first…
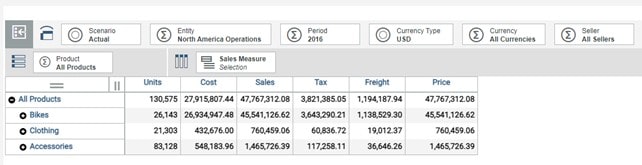
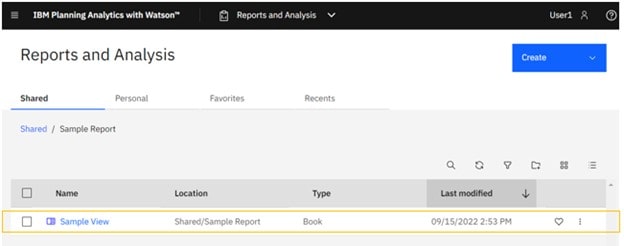
Dashboards at a Glance in Planning Analytics Workspace
Much of analytics is trying to decrease the amount of time and effort for converting data into valuable insights. Planning Analytics is a tool that does this very well. Since you’re reading this post, you are probably already familiar with Planning Analytics and web and reporting environment called Planning Analytics Workspace (PAW). PAW is great…
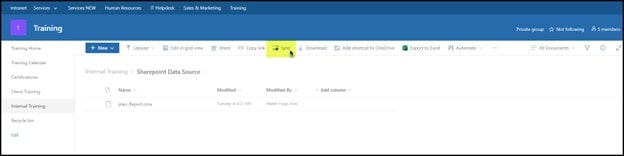
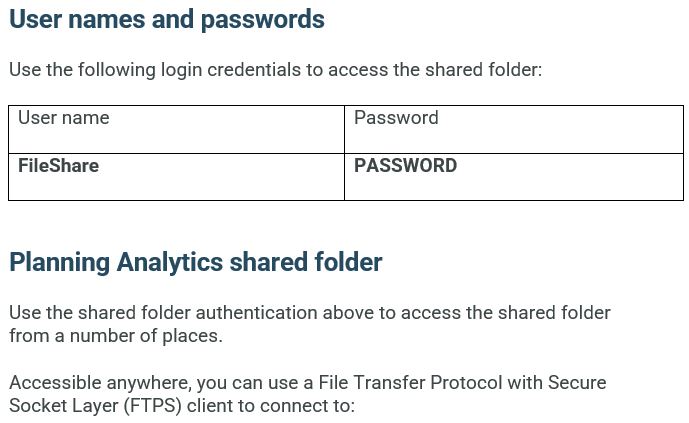
Using a SharePoint site for IBM Planning Analytics flat file data sources
Technology executives and managers are always looking for ways to be more effective while at the same time reducing costs in maintenance hours, physical servers, processes, etc.— It’s always a balancing act. One way to accomplish both goals can be by leveraging existing technology investments that are tried and true. Microsoft’s SharePoint and OneDrive is…
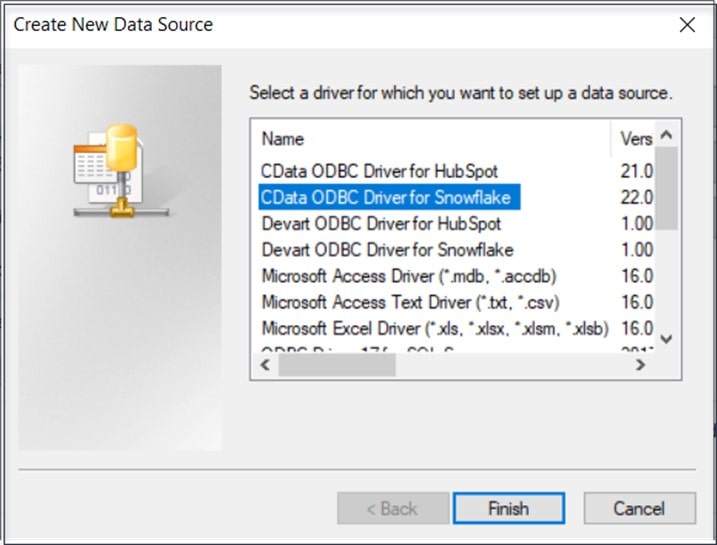
Integrating Snowflake and IBM Planning Analytics
In another post I explored how easy it is to access cloud-based Snowflake, create a database, define and then load a table with data from a local file. In this post, I investigate the steps required to integrate some Snowflake data with IBM Planning Analytics (TM1). The steps will include: Configure an ODBC Data source…
Troubleshooting PAW Security
PAW (Planning Analytics Workspace) has four types of security: User Role, User Group, Folder Security, and Book Security. These security types are separated from the database security, such as cube security, element security and process security. A PAW administrator usually helps a user fix security issue in PAW. This article covers the common security issues…
Diagnosing PAfE Performance Issues
IBM Planning Analytics for Microsoft Excel – or PAfE (previously referred to as PAX) – is a Microsoft Excel-based tool that report authors use to build sophisticated, multiple-sheet, multiple-query reports against multiple databases, including Planning Analytics models. If you are a PAfE user, or support a group of PAfE users, you may eventually need to…
Uploading data files to IBM Planning Analytics (Cloud)
Planning Analytics (PA) is a great platform for building models, such as workforce planning, revenue planning, and capital expenditure. These models require data from other systems. The cloud version of PA provides many data integration methods. However, a flat file is still useful when other data integration methods are not possible. To upload a file…
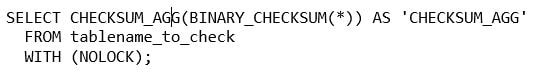
Using Hash Values in Planning Analytics
When working with IBM Planning Analytics, it is not uncommon to source data from a relational data source. Typically, you will see a Data Warehouse or Data Lake where data is transformed and loaded on a schedule using an ETL tool. ETL, which stands for Extract, Transform and Load, extracts data from a source, modifies it in some…
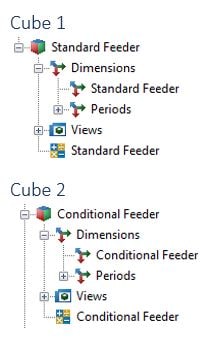
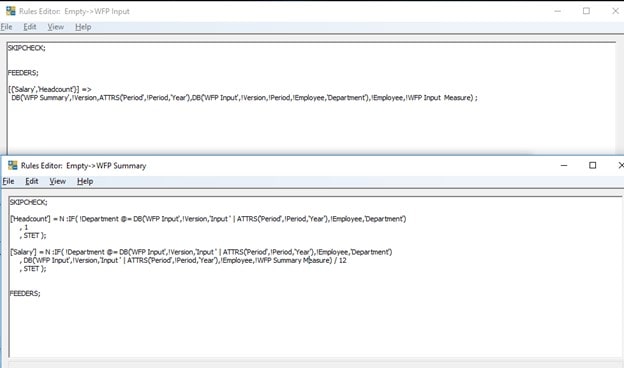
IBM Planning Analytics – Create More Efficient Feeders with Conditional Feeders
One of IBM Planning Analytics (PA) biggest advantages over other applications is the ability to use feeders. When it comes to issues of sparsity within cubes, feeders improve performance by giving developers a way to prevent Planning Analytics from trying to look through millions of intersections to find all the data to consolidate. Essentially, feeders…
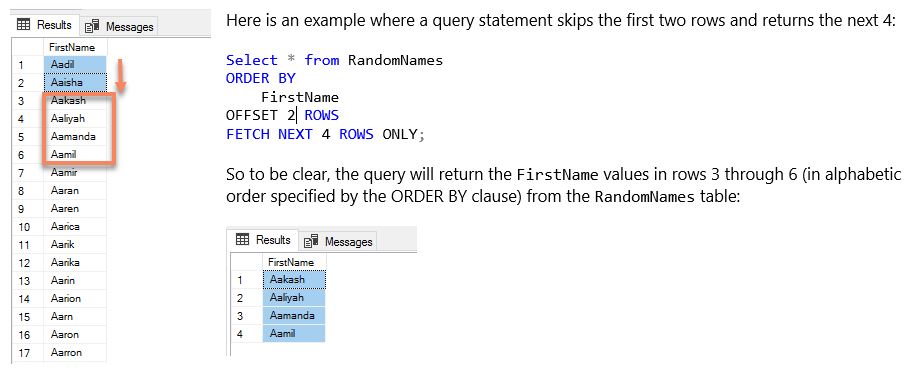
Using the SQL Server OFFSET-FETCH feature in IBM Planning Analytics
The OFFSET-FETCH filter is a SQL combination designed so that you can specify how many rows you want to skip before specifying how many rows you want to return in a SQL query. This can come in handy in a variety of ways such as returning results to the user one “slice” at a time…
How to shorten the data-processing time using the RunProcess command
We process more and more data every day. Some processing tasks take a few minutes while others take more than a few hours. The length of processing time depends on the amount of data, the speed of hardware, and how we process data. The first two factors are usually fixed for a given scenario so…
Connecting Snowflake to IBM Planning Analytics (Cloud)
Snowflake is a data warehouse, and it has gained a lot of popularity in recent years. Organizations choose to store and process their data in Snowflake which is a great data platform. Most organizations also need an analytics platform to build their forecast, perform ad-hoc analysis, and create dashboards. IBM Planning Analytics (Cloud) is an…
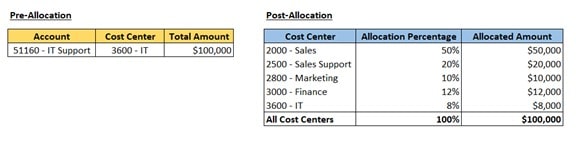
An Allocation Model in Planning Analytics
An allocation model is commonly used in a planning and budgeting process. A simple allocation model distributes an amount, such as expenses, to different segments of a business. The segments can be cost centers, departments, sales teams, etc. An example of a simple allocation model is an IT allocation model which allocates the total IT…
Using a Selector in Planning Analytics Workspace
Using a Selector in Planning Analytics Workspace A “selector” in IBM Planning Analytics Workspace (PAW) is a “widget” that lets you pick members, sets, or levels for a corresponding view of data. When a selector is synchronized with a view, what you pick (in the selector) is automatically applied to that view. For example, suppose…
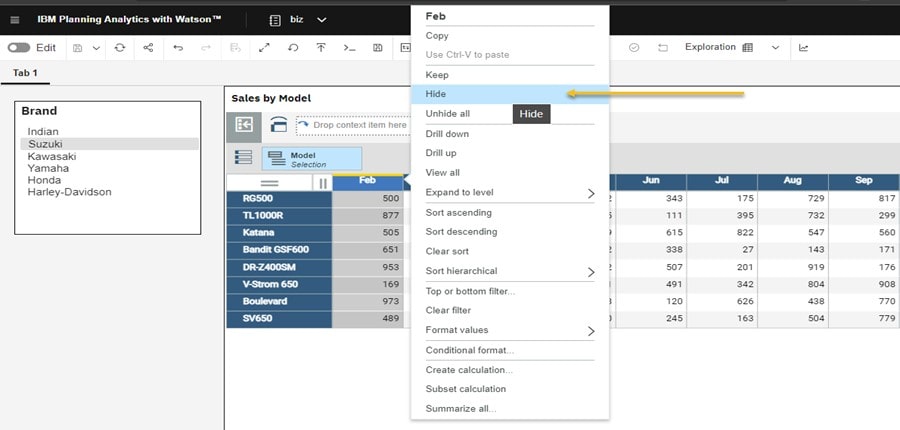
Hiding Components in Planning Analytics Workspace
One of the most common mistakes when designing a report, a view or a visualization of data is to include too much information. Too much information can make it difficult for consumers to formulate “takeaways” and gain insights. IBM Planning Analytics Workspace (PAW) provides an interface rich in options for presenting your data so it’s easy…
How to use one Title Dimension Selection to Control Another Dimension’s Subset in a PAW Cube View
A useful feature of building a cube view in Planning Analytics Workspace is the availability of using MDX to control dimension element selections. This functionality can be leveraged to use the selection made in one title element drive what element a separate dimension uses. In this article I have two examples. The first is using…
When To Feed from String Cells in IBM Planning Analytics
While developing an IBM Planning Analytics (PA) model, you may have come across a situation similar to the following: A rule and feeder are seemingly working correctly, but upon a data change the expected cells are not returning values, implying they are no longer being fed. Consider the example below showing a simple rule from…
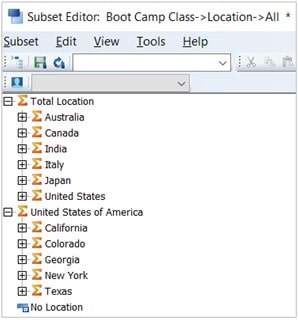
Utilizing an Alternate Hierarchy for Security in IBM Planning Analytics
IBM Planning Analytics (PA) allows administrator (admin) users to control users’ read and write access through different levels of object security. The system provides a set of redefined groups for admin purposes but allows custom groups to be created as well that users can belong to. Planning Analytics admins commonly use security controls to limit users’ access to elements within a dimension. This can be done by setting a security group’s access…

Best Practice for Number to String conversions in user-executed file exports in Planning Analytics
In some cases, it is necessary for a file to be exported by Planning Analytics as needed by the users of the system. In most cases this is done by using the ASCIIOUTPUT command in a TurboIntegrator process. When the export uses a NumberToString() function to convert one of the exported values from a number…
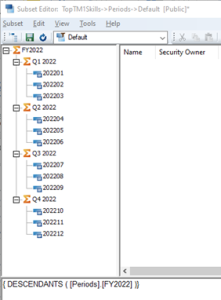
MDX Filtering Descendants for Dynamic Set in PAW
For those of you in the Planning Analytics (PA) world – Have you used any MDX lately? (MDX=Multi-Dimensional Expression). The goal of this article is to help you spot additional opportunities for MDX to assist in everyday analysis, reports, and extracts out of a PA model. This is a follow-on to an earlier Knowledge Base…
Using Dynamic Server References in PAfE Workbooks
In this article we look into creating a dynamic server reference with PAFE workbooks so that they can be successfully opened across multiple instances. Read on to learn why we do this, how to set it up, best practices, and some troubleshooting tips. What is a Dynamic Server Reference? Planning Analytics for Excel worksheet functions…
IBM Planning Analytics – Report Building Tips
What’s in a SUBNM? If you’re learning to build Excel based reports in IBM Planning Analytics, it’s important to understand the core FUNCTIONS and features that drive the report. Several of these functions can be customized to provide flexibility in both format and content. (i.e. TM1RPTVIEW, TM1RPTROW, SUBNM, MDX) Today, we will focus on the…
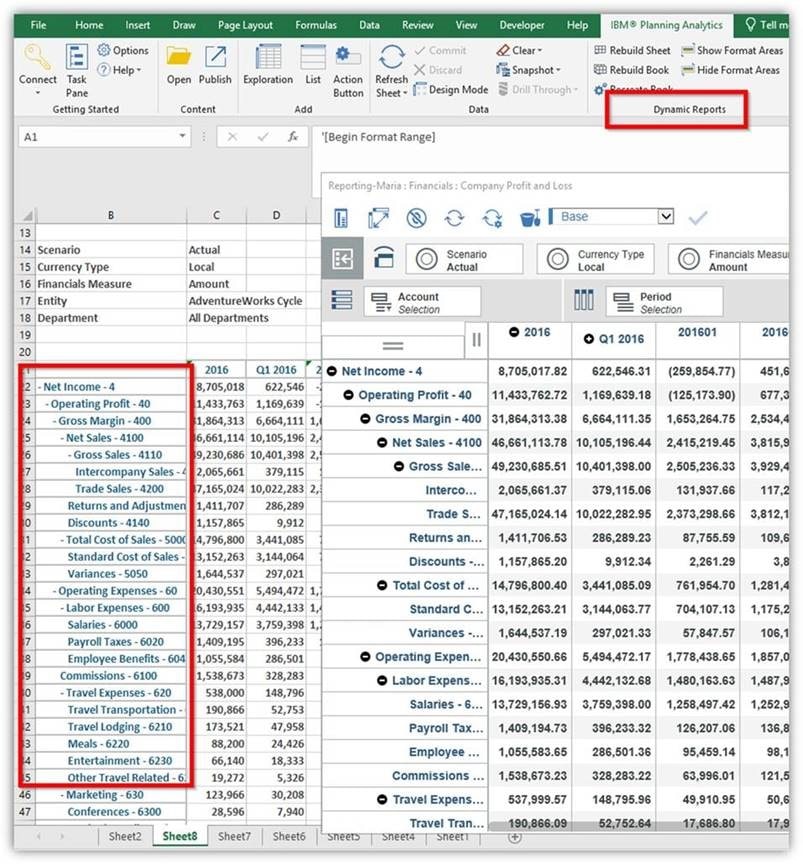
Creating Level-Based Row Indentation for Planning Analytics for Excel (PAfE) Reports
Level-based row indentation is a great way to add quick readability to your Planning Analytics for Excel (PAfE) reports. Instead of having a list of elements all left-aligned, we can add indentation based upon each member’s level to help report readers understand hierarchies within the dimension. Exploration Views, Quick Reports and Dynamic Reports all have…
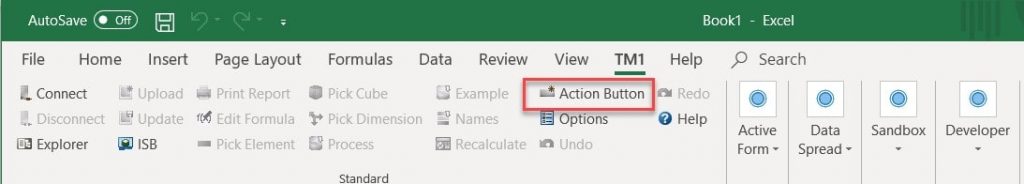
How to Add and Configure an Action Button
Adding an Action Button To add an action button, click on the cell where you want the button to be placed, then go to the TM1 ribbon, and click “Action Button” A button is created, and the action button properties window will open. Here you can define the button’s action properties. Action Button Actions: An…
Automating Planning Analytics Report Distribution, or Where is My Print Report?
With the move from Perspectives to the new-and-improved Planning Analytics for Excel – many people are asking “Where is my Print Report?” For those of you who’ve never experienced Print Report in all of its glory, it was an amazing feature in Perspectives that allowed users to generate reports with multiple sheets or books driven…
Dynamic sub-totals when hierarchies are not available
In any given TM1 model developers make use of attributes in a dimension. These attributes can have a multitude of uses, i.e. driving calculations or serve as reference in a report or sometimes they drive hierarchy structures and many others. The use case we will discuss in this instance is the use of attributes to…
Quick and Easy Top-Down Planning in PAW
So, you’ve spent some long hours painstakingly gathering inputs from all department heads to build up your highly detailed, bottoms-up forecast in Planning Analytics and now the CFO wants to make some high-level (top-down) adjustments. All the previous data spreading options (repeat, proportional, growth, etc.) are still available by right-clicking a cell and selecting data…
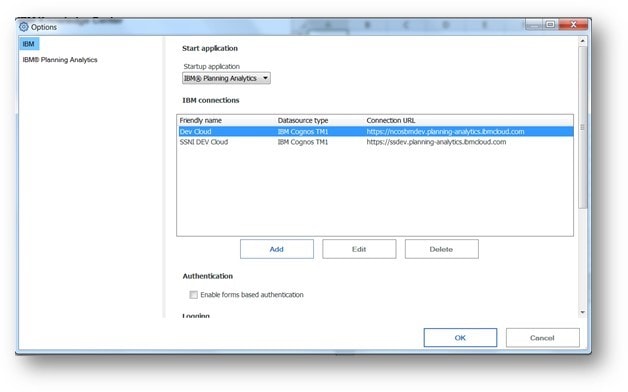
How do I Set Planning Analytics for Excel (PAx) Options?
There are various options that apply to Planning Analytics for Excel that are recommended to be reviewed and set. These include the following: Startup Options You can choose your “startup application”. This is nice if your routinely connect to a multiple Planning Analytics environments, but prefer one as your “default”. To do this, click on the…

How to Publish & Share Planning Analytics for Excel (PAx) Reports
Publishing reports from PAx (Planning Analytics for Excel) is accomplished in exactly the same way as when using Perspectives/TM1Web and only TM1 Admin level users can publish reports. To share your PAx report, you click on the PAx Publish icon: This opens the Publish dialog (shown below). Here you can…
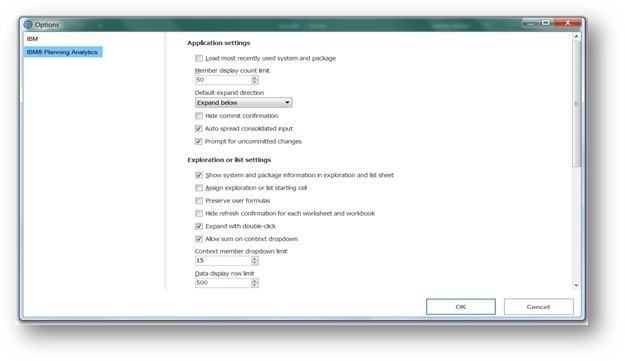
Planning Analytics for Excel (PAx) Application and Exploration Settings
To set these options, click on the Planning Analytics for Excel menu item and then click on Options. The Options dialog box will appear (shown below). Next click on IBM Planning Analytics (in the upper left). Here is where you can set the expand option to…

IBM Planning Analytics Process Synchronization
IBM Planning Analytics Process Synchronization Synchronization in Planning Analytics counter-intuitively does not ensure that TI processes run at the same time, in synchronization. Instead, it ensures that only one process with a given synchronized flag is allowed to run at a time. The main use cases for “synchronizing” processes in Planning Analytics by using the…

Characteristics of a “Good” Data Model in IBM Planning Analytics
IBM Planning Analytics – Characteristics of a “Good” data model Modeling Many “strategies” exist today for modelling (building a database) in IBM Planning Analytics. If you are a member of the IBM Community, you’ll find no shortage of opinions and recommendations – from informal blogs and discussions to more formalized courses and mentoring. In fact,…

PAfE Reporting Hints
IBM Planning Analytics for Microsoft Excel (or “PAfE”) is a Microsoft Excel-based tool that can be used to build complex, multiple-worksheet, multiple-query reports against multiple databases. You can use the information here as a quick start guide (and then a reference) providing helpful suggestions on using PAfE. If you haven’t yet installed PAfE and need help…

KB – TI Process Debugger
Planning Analytics Workspace TurboIntegrator Process Debugger The highly anticipated TurboIntegrator (TI) Process Debugger is now available in Planning Analytics Workspace. This valuable functionality is included in the 2.0.84 release update, opening new possibilities for developers to investigate, diagnose, and resolve issues within their TurboIntegrator processes. In this article, we will dive into the core functionality…

Leveraging Existing Planning Analytics Assets
At some point you may have developed and delivered some sort of financial model in TM1/Planning Analytics – perhaps starting with the reporting of financials – and have now been tasked to “add” planning and budgeting (or other) functionality to it. Before you even begin gathering requirements for the new functionality, it is recommended that…
Building a Planning Analytics “Information Front Porch”
Building a Planning Analytics “Information Front Porch” Exchanging Information Most enterprise PLANNING ANLAYTICS applications will have bidirectional exchanges of information with external systems and sources. With PLANNING ANLAYTICS’s TurboIntegrator, you can consume files of data and even connect directly to (supported) data sources to load information directly into PLANNING ANLAYTICS objects at scheduled…
5 Powerful MDX Functions to use in your IBM Planning Analytics Model
IBM Planning Analytics (PA) subsets can be made dynamic through multi-dimensional expressions (MDX). This reduces manual maintenance and ensures that subsets display the latest metadata and data available in the model. For example, when the Current Year of a model is modified, an MDX driven “Current Year Months” subset will be updated immediately. Today we…
Planning Analytics Changes to MDX Subset Evaluation in 2.0.9
Planning Analytics Changes to MDX Subset Evaluation in 2.0.9 July 2020 UPDATE: IBM has reverted the change described in this article in release 2.0.9.2 of Planning Analytics (PA), which is now available to Local and IBM Cloud customers. Additional background and information about this issue, and the fix by IBM, can be found in this…
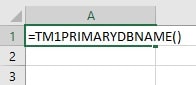
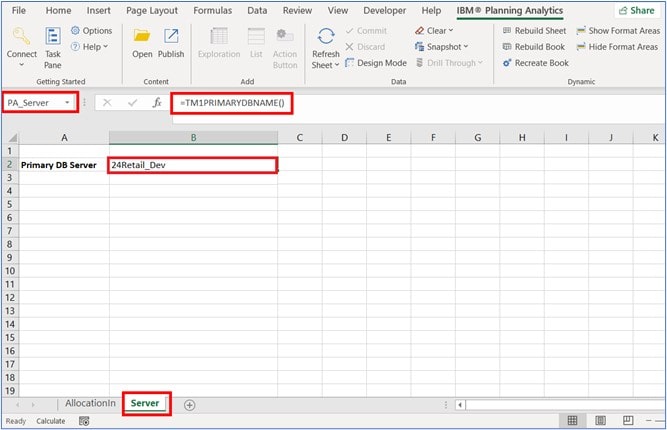
Dynamic Planning Analytics Server Names in PAX
The main difficultly when migrating a Planning Analytics for Excel (PAX) report or input template from one Planning Analytics (PA)/TM1 Server to another is making sure it will work across both servers. Every PAX function, like a DBRW or SUBNM, requires the cube name or dimension name be prefixed with the Server name that is…
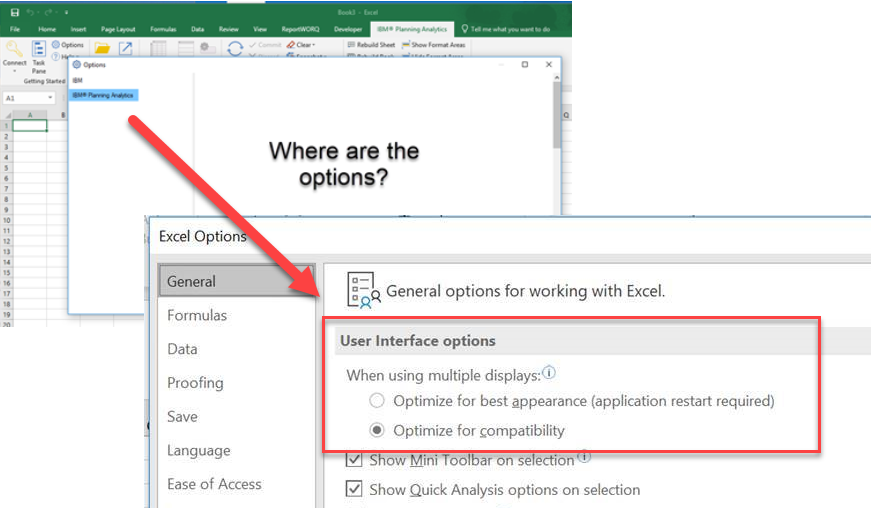
Why are my PAx Options blank?
Why are my PAx (Planning Analytics) Options blank? You’ve just installed PAX opened the Options screen and there is nothing there. This is a known issue that can effect some users with multiple displays. Resolving the issue is quite easy. Open Microsoft Excel and navigate to the Options >> General >> User Interface Options section…
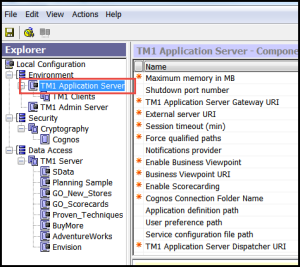
TM1 SSL Certificates Fix
TM1 SSL Certificates Fix Issue: Can’t see any TM1 Servers in Server Explorer Resolution: Check to make sure the SSL Certificates have been updated Affects: TM1 versions prior to Planning Analytics, If client installs TM1 on a new server or client machine This blog entry is an update to our blog posted on Sept 27,…
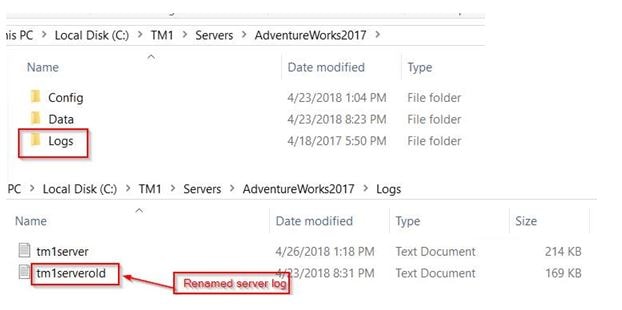
TM1 Server won’t start
TM1 Server won’t start Issue: tm1s.log file may become corrupt Resolution: Rename existing tm1s.log and restart TM1 server. TM1 will create a new tm1s.log file. Tm1server.log file is located in the Logs folder. This will most likely be in the same location as your Data and Config folders. Rename tm1server.log to tm1serverold.log Restart TM1 server…

Selecting, Copying and Loading Performance in IBM Planning Analytics
IBM Planning Analytics – Selecting, Copying and Loading Performance Selecting, Copying and Loading Moving data into, around, and “out of” a Planning Analytics model are examples of common operations and constitute essential practices. Loading usually involves executing database commands to select information from external data sources, perhaps from a transactional general ledger system or from…

Do I Need an IBM ID?
Do I Need an IBM ID? If you are responsible for supporting IBM Planning Analytics (PA), are the “newly appointed” PA or Planning Analytics Workspace (PAW) administrator for your organization or simply a Planning Analytics “consumer”, at some point you will want to “interact” with IBM in respect to potential new offerings, version availability, downloads,…
Sparklines in Planning Analytics (without Excel)
A sparkline is a tiny chart that provides a visual representation of data. You can use sparklines to show trends in a series of values, such as seasonal increases or decreases, economic cycles, or to highlight maximum and minimum values. Sparklines are typically positioned near its data for greatest impact. Google search and you’ll most…
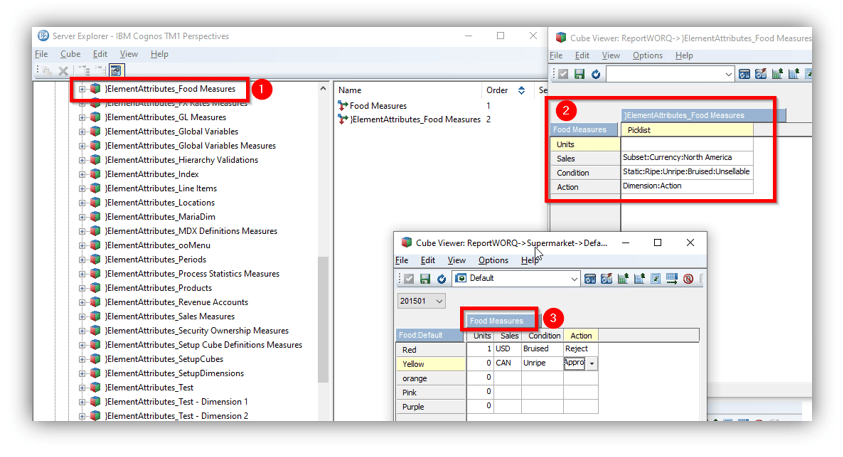
How to Create TM1/IBM Planning Analytics Picklists with Dimension Attributes or with Rules
Picklists are a beloved feature in TM1/Planning Analytics (PA) as it helps prevent user input errors, by limiting the values that can be typed into a cell. How to Create a Picklist in TM1/PA using Attributes: Create an attribute off any given dimension and name it “Picklist.” Write the element attribute names. In this example,…
Creating Professional PAW Dashboards
Are you looking for professional ways to display your organization’s data within Planning Analytics Workspace (PAW)? Well, you have come to the right place! When illustrating your complex operational and financial data, it helps to have a clean and consistent budgeting and forecasting presentation to drive planning efficiency. The tips below offer quick ways to…

Use Snap Commands for Natural Language Queries
Planning Analytics Workspace (PAW) has many new features that enhance the user experience and make accessing and analyzing data easier than ever. The new Snap Command feature in PAW allows users to use natural language commands to manipulate explorations and other visualizations – this can be a huge time-saver! The Snap Command feature can be…
Using Pop-Up Text in PAW
Using Pop-Up Text in PAW Space can sometimes be at a premium in Planning Analytics Workspace (PAW) dashboards and reports and using Pop-Up Text is a great way to preserve valuable real estate while still being able to provide users with any additional information or instructions needed to make your user interface as intuitive and…
Learn How Planning Analytics Improves Business Decision Making
Find out how data and planning analytics can transform the way your company makes crucial decision by reading our eBook 4 steps to better decision making and requesting a meeting with a Planning Analytics expert.

SPSS
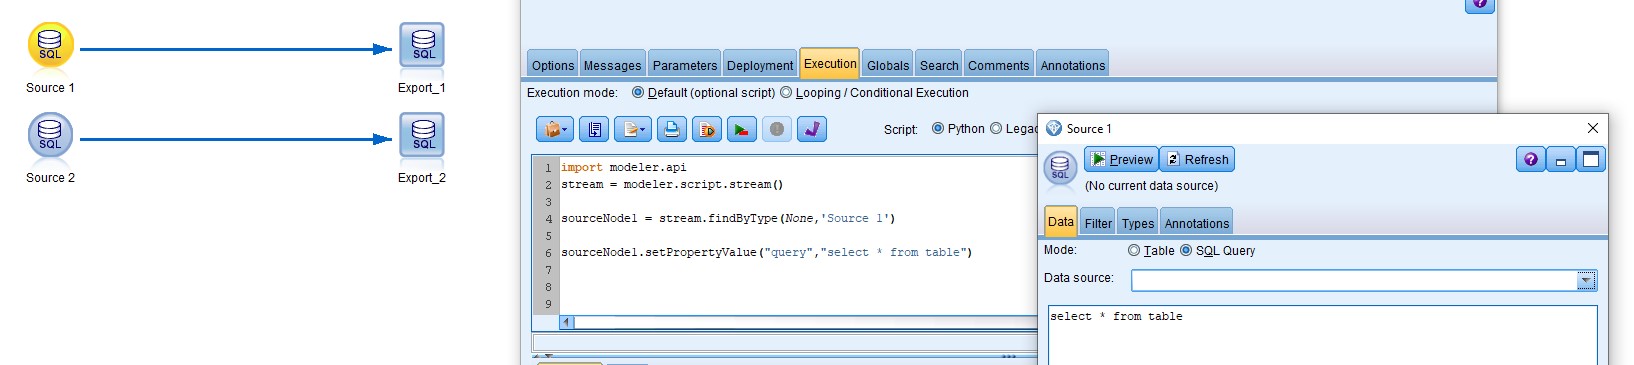
SPSS Modeler: Advanced Stream Automation
If you’re just starting scripting in modeler, please read the Basic Stream Automation article before this one! In this article, we’ll talk through three more advanced topics including: Setting properties of nodes Looping through nodes to set connection properties on multiple nodes at once These are extremely common use cases that can be combined to…
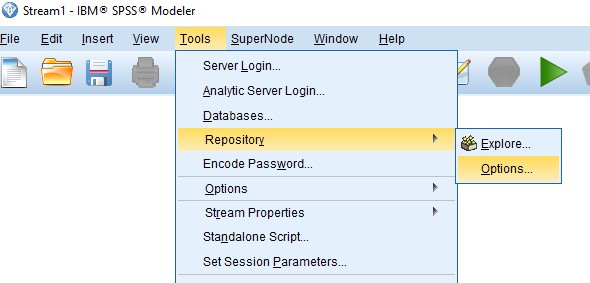
SPSS Modeler: Managing Streams using Collaboration and Deployment Services (C&DS)
IBM SPSS Collaboration and Deployment services, or C&DS, is a tool for managing SPSS content. This includes version control and job creation/stream automation. In this article, we’ll go through the SPSS Modeler interface for interacting with C&DS – storing streams, retrieving streams, and managing version control. Connecting to the C&DS Repository To connect to the…
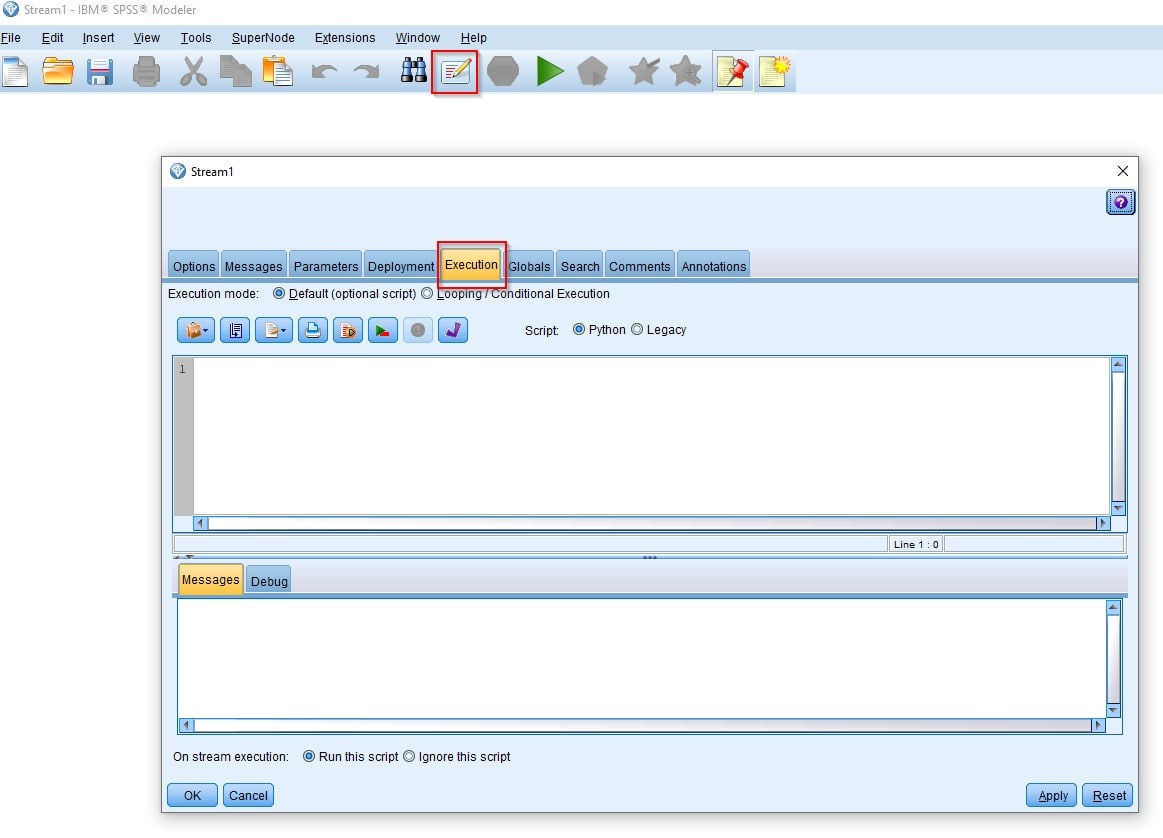
SPSS Modeler: Basic Stream Automation
Scripting in Modeler is an extremely powerful way to automate processes and execution of streams. Just about any action that you can perform manually can be automated using the Jython scripting API. This is convenient if you’re running the stream from within Modeler client, and extremely important if you’re running the stream outside of Modeler…