
IBM Planning Analytics for Microsoft Excel (or “PAfE”) is a Microsoft Excel-based tool that can be used to build complex, multiple-worksheet, multiple-query reports against multiple databases. You can use the information here as a quick start guide (and then a reference) providing helpful suggestions on using PAfE.
If you haven’t yet installed PAfE and need help with that (or you want to upgrade to a newer version), you can find that information here.
PAfE Version
Newer versions of PAfE are routinely made available to address reported issues, offer updates to features and sometimes even add new functionalities.
It is highly recommended to keep your version of PAfE current and to stay current, it is important to know which version of PAfE you are currently using. To find which version you have installed, you can follow these steps:
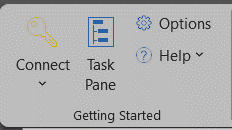
- Click the IBM Planning Analyticstab to open the IBM Planning Analytics
- Click the Helpdrop down (located in the Getting Started group).
- Click About.
Once you verify the version of PAfE you have, you can check online here for that particular versions highlighted features and fixes.
Creating a Connection
To create reports with PAfE using Planning Analytics data, you need to first create a connection. To create a connection, you can follow these steps:
- Open the IBM Planning Analyticsribbon and click Options to open the Options dialog box.
- In the navigation pane of the Optionsdialog box, click IBM.
- Click Addto create a new connection to a datasource.
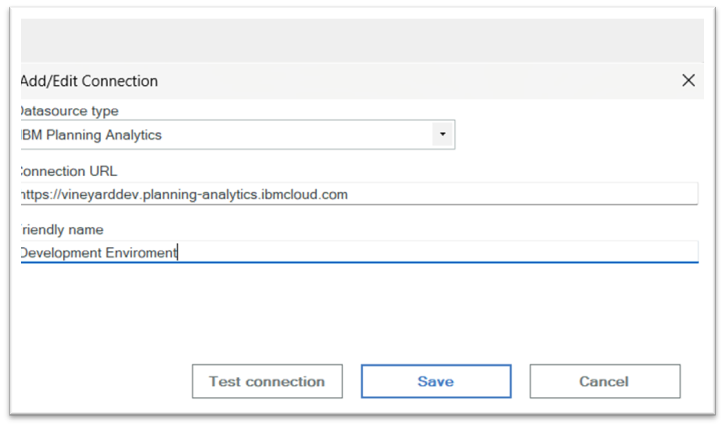
- On the Add/Edit connection dialog, select the datasource “IBM Planning Analytics” as the Datasource Type.
- In the Connection URLbox, enter the URL of the Planning Analytics server that you want to access. This will be the Connection URL for the Planning Analytics Workspace (PAW) Server (either the computer name or IP address). Ask your administrator for this if you are not sure (it will be a https…). While you are at it, ask if there are URLs for your production (live) environment AND a test or sandbox environment.
- In the Friendly Namebox, enter a name for your new connection.
- Click Test Connectionto assess if the URL that you entered is live (if the connection fails, you need to verify the connection URL).
- Click Save.
Report Types
There are a number of PAfE report “types”, including: Exploration Views, Lists, Quick Reports, Dynamic Reports, Universal Reports, and Custom Reports (you can even use multiple types in the same workbook or report). Each report type has its own benefits and limitations. This document will highlight a helpful approach for creating a simple custom report.
Building a Custom Report
To quickly and easily create a custom PAfE report, you can start by following these steps:
First, use the connection documented above (or one previously created) to connect to the desired Planning Analytics environment, then determine a cube to report on (if you are connected to Planning Analytics you should see a list of cubes in the task pane). Here is a helpful link that identifies where to find the Task pane as well as all of the major areas of the IBM Planning Analytics for Microsoft Excel (PAfE) user interface.
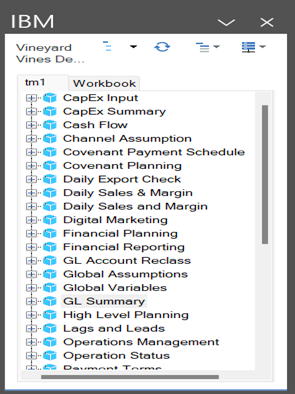
Task Pane
For this example, I used a GL Summary cube so in the above-mentioned task pane, I expanded the GL Summary cube by clicking on the plus sign to the left of the cube name. Then, under the cube, I expanded the Views and located one that “fit” my report requirements, right clicked on the view and selected Custom Report, then On this sheet. Hint: If you are not sure which view to use, you can right-click on a cube and select Open in Viewer, then, using the cube viewer, you can create and save a view that fits the needs of the report you want to build.
Shown below is the view I created showing FY2024 (along with quarters), and using the account dimension subset named “Detailed Income Statement”:
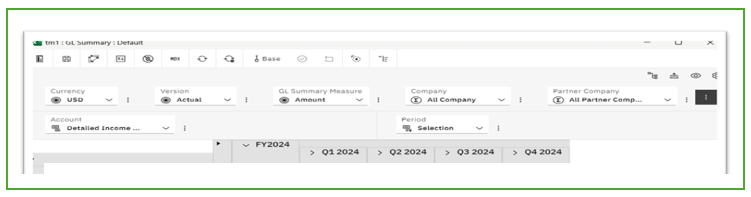
Sample Custom Report
Next, I clicked on Save to Server and named my view “Report Example 001”:
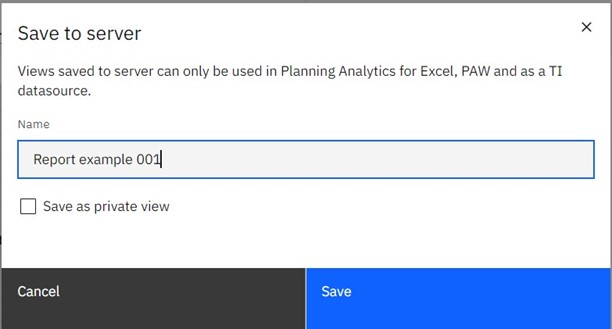
Saving a New View to the Server for Later Use
Now that the new view is listed in the task pane under Views, you can add it to your worksheet as a custom report.
Hint: Give some thought to report names, try to make them obvious to the consumer as to what the report contains and/or its objective. Additionally, strive for consistency with your organization’s naming practices, paying specific attention to case, use of special characters, punctuation, and formatting (like YYYYMMDD).
Customization
Once a view has been added to a worksheet as a custom report, if you click on cells in the worksheet you can view, add and/or edit formulas (as shown below):
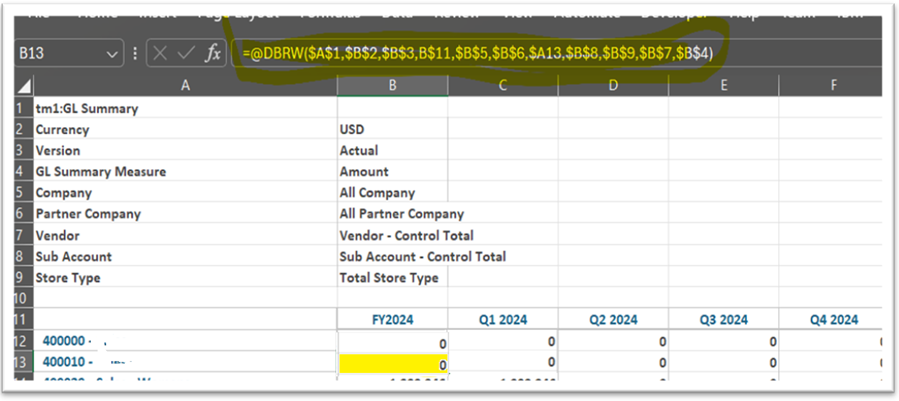
Custom Report (added to a worksheet) Showing Cell Formula Highlighted
In this example, you can change the period values from FY2024, Q1 2024, Q2 2024, Q3 2024 and Q4 2024 to: FY2022, FY2023, 202401, 202301 and “Delta” by simply typing those values into the cells. You can also add MS Excel formulas directly to cells (perhaps the math to calculate each the difference between columns as the delta) a and then recalculate the worksheet to see the results.
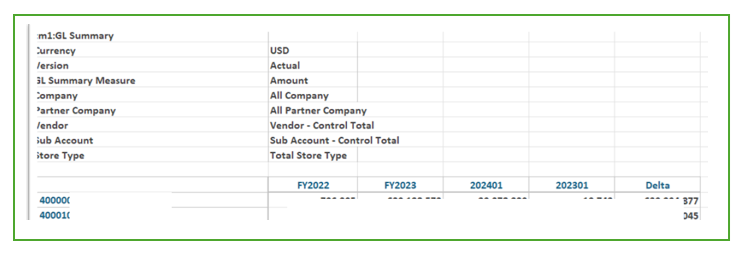
Updated Custom Report
Formatting
One benefit of working in IBM Planning Analytics for Microsoft Excel (PAfE) in “cell-based mode” is that the features of Microsoft Excel become readily available to you. You are able to use Excel features, such as formatting, sorting, and creating formulas using individual cells. Hint: “less is more” – meaning that you have the ability to hide any cell/row/column in your report that may be irrelevant to the reports message or contains information that the consumer need not see. For more information on some of the ways that IBM Planning Analytics for Microsoft Excel interacts with frequently used Microsoft Excel features and functions, read this.
Another neat feature worth mentioning is that you can create and share customized report themes.
Worksheet Functions
IBM Planning Analytics Worksheet functions manage data between Planning Analytics and a Worksheet. You can use TM1/Planning Analytics worksheet functions anywhere in an IBM Planning Analytics for Microsoft Excel (PAfE) worksheet. For help adding functions to your report, you can reference (and build) these functions (in Microsoft Excel), you can click on Formulas then Insert Function, or by clicking on Insert Function in the formula bar:
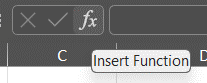
The Insert Function dialog box that appears gives you a list of operations that Excel can perform, including all of the TM1/Planning Analytics formulas. You can also use this dialog to construct and then add functions to a report. Working functions can also be copied from cell to cell and then edited.
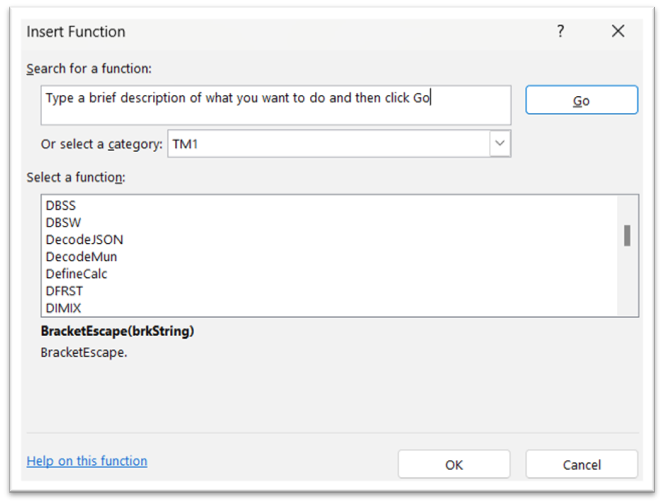
Insert Function Dialog Box
Slow Reports – Thinking about Performance
When building reports , keep in mind that there can be issues with performance caused by the use of certain Excel formula functions. Certain functions, or the way the functions have been implemented within a report, can cause unwanted recalculation. One example of this is using Excel functions on column headings (or other cells) that DBRW formulas implanted on the rows reference. Every entry into a cell has the potential to cause the entire worksheet to recalculate. “Unpredictable” behavior may also be caused by using OFFSET, INDIRECT and SUMIF (Excel functions).
If any TM1/Planning Analytics formulas are dependent on the results of these functions, you may want to rethink their use (you can read more about PAfE performance here).
Additionally, there is a difference in the way some TM1/Planning Analytics functions behave which can have a material impact on your report’s performance and therefore you should consider when to use each (in fact, for a larger or more complex report, a little time spent experimenting with different functions is time well spent).
- DBR functions are executed individually during worksheet recalculation
- DBRW functions force TM1/Planning Analytics to execute two passes over the worksheet (in the first pass, all changed values in cells containing DBRW functions are sent in a single bundle to the cube)
- DBS functions update individually during recalculation
- DBSW functions enable TM1/Planning Analytics to send all modified values within a worksheet in a single bundle
Dynamic Server References
To make it easy to move PAfE workbooks (reports) between Planning Analytics servers, for example your development and production servers, you should create a Dynamic server reference within each report. This means that all TM1/Planning Analytics functions within your report use a single-cell value dynamically referring to the planning analytics server that you are signed in to. What this does is allow you to “point” a report to a different environment without having to update the report. For more details on this task, you can read this.
TM1USER
There are many other helpful TM1/Planning Analytics functions; one is TM1User which returns a string giving the current TM1 client. When used in a worksheet it will return the logged in user’s TM1 client name. You can investigate the complete list of TM1/Planning Analytic functions here.
Sharing Reports
Once you are happy with your report it is vital that you “store” it in a safe place (one that is secure and is backed up on a routine basis). Saving it on your local drive simply is not reasonable, especially if others will need to access it. The best option for saving, securing, and sharing a PAfE report is to publish it.
When you publish a report, it is saved under the TM1 Server Application folder. The report can then be opened using Planning Analytics for Excel (PAfE), TM1 Web and in Planning Analytics Workspace (PAW) (and more importantly, is eliminates emailing and potential of someone using an older version of a report).
- On the IBM Planning Analyticstab, click Publish.
- Select a TM1 connection.
- Select a TM1 Server Application folder.
- Select a folder or create a new folder.
- Type a name for the workbook.
- Optional: Enter a description.
- Click Publish (by default, newly saved workbooks are private. Right-click the workbook in the Publishdialog box and click Make Public to make the workbook public0.
Conclusion
Hopefully the information provided here was helpful, and makes you want to learn more, if so, there is plenty more “getting started” information online.