
Planning Analytics Workspace TurboIntegrator Process Debugger
The highly anticipated TurboIntegrator (TI) Process Debugger is now available in Planning Analytics Workspace. This valuable functionality is included in the 2.0.84 release update, opening new possibilities for developers to investigate, diagnose, and resolve issues within their TurboIntegrator processes. In this article, we will dive into the core functionality of the TI debugger in PAW, highlighting its ability to enhance your troubleshooting experience.
Enabling the TI Debugger:
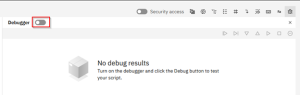
Debug mode can be enabled while editing any process within a workbench. In the top right of the process window, the debug option can be found on the far right of the available options. The debug window will open on the right side of the process window upon clicking on the bug icon.
![]()
In the debug window, debug mode can be toggled on by clicking the button next to “Debugger”.
Once enabled, the standard “Run” button transforms into a “Debug” button. Clicking the “Debug” button initiates the process, but execution is paused before running the first uncommented line of code. Continuing the execution and debugging of the process is controlled by the options available within the debug window.

Debugging Execution:
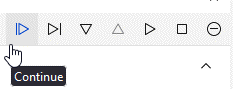
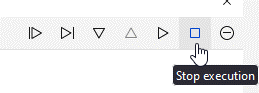
Once the debugging has been initiated, the debug operation is controlled using the seven buttons available in the top-right of the debug window. More information on the functionality of each of these buttons is provided below. It should also be noted that during execution, minor errors will not be raised during debugging, and will create a process error log file as usual. Major errors will immediately terminate execution of the process.
![]()
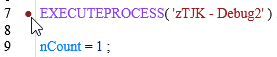
While debugging, the process editor highlights the line of the process that it has paused on. In the case below, the process has paused on, and not yet executed, line 4.
![]()
Execution Control Buttons:
Continue:
The “Continue” button will continue the execution of the TI Process until it reaches the next breakpoint; more on these later. If there are no further breakpoints in the process, it will complete the process as normal.
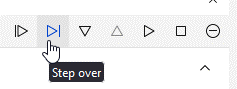
Step Over:
The “Step Over” button will execute the current highlighted line of the process. After executing the code on that line, it will pause before executing the next uncommented line of the process. This is useful for executing a process step-by-step without creating breakpoints for every line. If Step Over is used to run a line of code that executes another process, it will executes that process as normal.
Step In:
The “Step In” button has nearly identical functionality to the “Step Over” button. The only difference is when running a line of code that executes another process. Unlike Step Over, Step In will open the sub-process that is run in debug mode, so that debugging can continue within the next process.

Step Out:
The “Step Out” button is only used after using Step In to enter debug mode in a sub-process ran by the process you are debugging. Step Out will finish the execution of the sub-process and return you to debugging the process that called it.

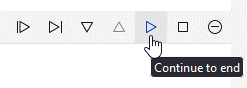
Continue to End:
The “Continue to End” button will continue the execution of the TI Process until completion, ignoring any breakpoints.
Stop Execution:
The “Stop Execution” button will immediately end execution of the process debugging. This button effectively has the same functionality as clicking the “Cancel” button to end execution of the process.
Remove all Breakpoints:
The “Remove All Breakpoints” button simply removes all breakpoints added to the process. Clicking this button does not resume execution of the process.

Breakpoints:
The TI Debugger allows the creation of breakpoints within the process code. When added, breakpoints pause the execution of the process before running the associated line of code. By strategically placing breakpoints, troubleshooting efforts can be focused on critical sections of the process.
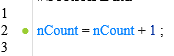
Breakpoints can be added to any line of uncommented code by clicking in the whitespace between the line number and the process code. A small red dot will appear next to the line to indicate that a breakpoint has been added.
The debug window includes a “Breakpoints” section that displays all added breakpoints. In addition to showing the line of each breakpoint, this section allows the addition of expressions to make breakpoints conditional.
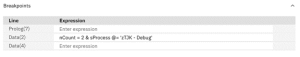
To make a breakpoint conditional, define an expression that determines when the breakpoint should activate. Once made conditional, the red breakpoint dot turns green, and the breakpoint will only be triggered when the associated expression evaluates to TRUE.
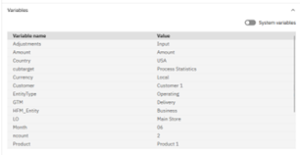
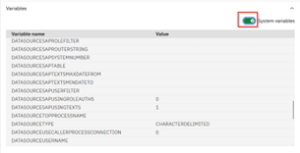
Variables:
The debugger provides a dedicated panel for inspecting variable values during process execution. This panel allows the examination of the values of local and system variables, track their changes, and identify any discrepancies. It serves as a valuable tool for validating the process logic and quickly identifying anomalies or unexpected results. The display of system variables can be toggled using the button located in the top-right corner of the Variables section.
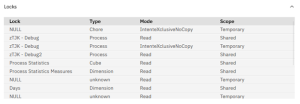
Locks:
The debugger also has a dedicated window to display Lock information during the debug execution of the process. This can be useful for determining issues associated with lock contention during the execution of processes. Refer to IBM documentation on Locks for more information.
Conclusion:
The TurboIntegrator Process Debugger in Planning Analytics Workspace empowers developers to streamline the debugging process, improve code quality, and enhance development productivity. By enabling the debugger and leveraging its functionalities, developers can efficiently investigate and resolve issues, resulting in more reliable and efficient TurboIntegrator processes.