
Debugging a TurboIntegrator Process
What is TurboIntegrator?
Planning Analytics/TM1 TurboIntegrator lets you create processes that automate work such as data importation, metadata management, and other tasks. Each process is a “script object” that consists of:
- A Data Source description (of an ODBC source, ASCII file, OLAP multi-dimensional source TM1cube view or, TM1 dimension subset)
- A Set of Variables that correspond to each column (or field) in the data source
- A Prolog procedure (which will consist of a series of actions to be executed before any data is processed)
- A Metadata procedure (consisting of a series of actions that update or create cubes, dimensions, and other metadata structures)
- A Data procedure (which will be a series of actions to be executed on each record in the data source).
- An Epilog procedure (which is executed after all the data has been processed)
A TurboIntegrator process may also include a “set of mappings” used to define relationships between variables and data already in the Planning Analytics/TM1 database or model. Additionally, you can also add “parameters” to a process which can be used to generalize a process so it can be used under multiple circumstances. Those “series of actions” you create in the process “procedure sections” must follow specific syntax (like other scripting languages) and can include provided functions that you can use to enhance the process capabilities with conditional expressions to control processing and meet other business requirements.
A Debugging Use Case
During my career I have often heard, “my TurboIntegrator load process runs and completes without any errors, but it doesn’t load or update any data. What’s happening?”
My response is that there are only three possible explanations:
Option1: There are update/insert errors
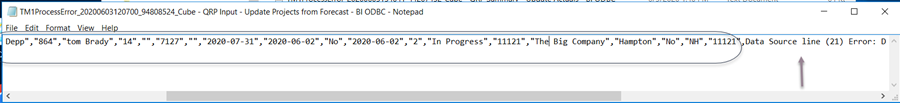
Check the logs folder. If there is an update/insert error, then Planning Analytics/TM1 will generate an exception (.log) file and skip the data record. You can open the log file with a text editor (like Notepad) and use the information in the file to identify the record(s) that are causing the error. The log file will show the data record values, the procedure section that the error occurred in and the actual line number (of the procedure section) that the error occurred on:
Option 2: The data records you expect to update or insert (into Planning Analytics/TM1) are being explicitly skipped.
This is caused by mistakenly telling the process to exclude certain records from being processed.
If this is what you suspect may be occurring, you should check for a wrongly a placed ITEMSKIP function in the “procedure sections” of the process, an incorrect conditional expression or logical operator, and review the defined data source to verify that it includes all of the data you are expecting.
ITEMSKIP
It is easy (especially when you are working with a process that you didn’t initially create yourself) to overlook statements that might intentionally skip records based upon specific conditions. For example, you might find something like this lurking within your Data procedure section:

In this example, the original business rule dictated that “Street Bikes” (motorcycle models) need to be skipped (the ELISANC function checks if “nModel” is child or grandchild of the consolidated element “Street Bikes” and if it is, the data record is skipped). Is this still a valid requirement?
Logical Operator
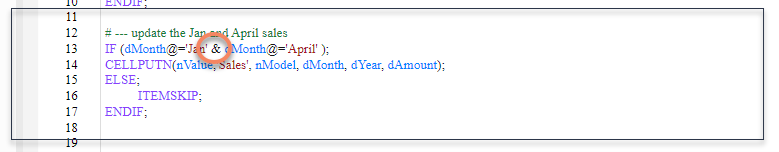
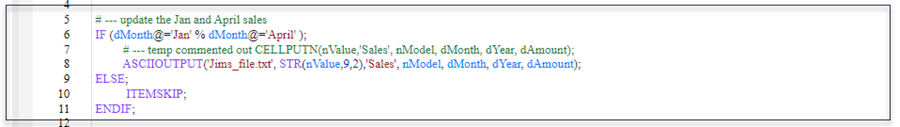
An example of an error with the use of a logical operator is shown below. The intention is to update the Sales cube if the month is Jan OR April, but the IF condition is testing for Jan AND April, so the data record is skipped:
Data Sources
Finally, if your data source is a cube view, you can change the VIEWCREATE statement to create a static view which will “keep” the view around after the process completes so that you can verify that it is correct. To do that, change the AsTemporary parameter of VIEWCREATE to a zero. Something like this (“Sales” is our cube name, “1st Quarter Actuals” is the name of the view being created and 0 is the value of the AsTemporary parameter:
ViewCreate(‘Sales’, ‘1st Quarter Actuals’, 0);
Once the view is created, you can use Planning Analytics Workspace (PAW) to open and verify that the view is created as you expected. Another “trick” once you have the view created (and if you have access to Architect) is to right click on the view name and select “Export as txt Data…”
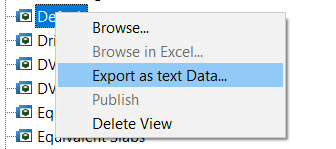
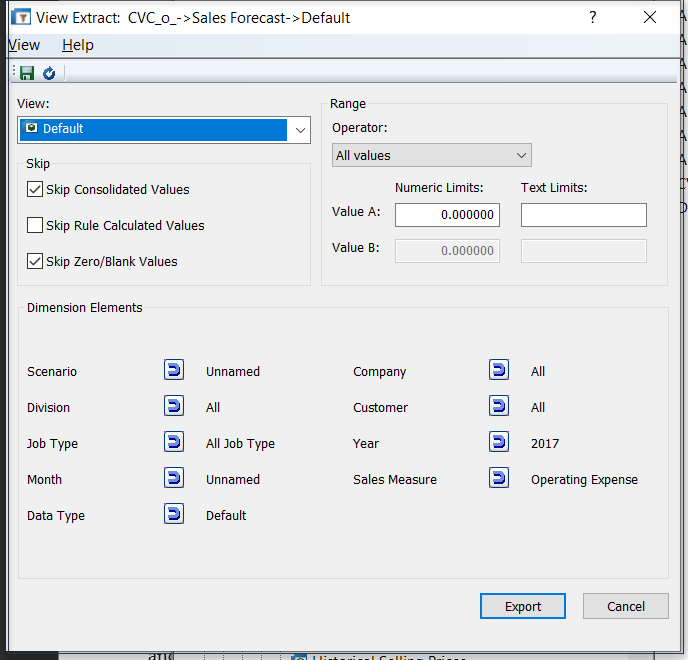
Once you do that, Planning Analytics/TM1 will open the “View Extract:” dialog (you won’t need to click the Export button). This dialog will allow you to confirm the “Skip parameters” (Consolidated, Rule Calculated and Zero/Blank) and “click through” each of the selected Dimension Elements to verify them:
Option 3: The data records you expect to update or insert (into Planning Analytics/TM1) are being updated or inserted, however the “target” isn’t what you expect.
If this is what you expect is occurring, a simple course of action is to replace the CELLPUTN (or CELLINCREMENTN) with the ASCIIOUTPUT function and rerun the process. This will generate a text file showing you the specific data intersection points that the process is referencing.
In this above example our CELLPUTN is “commented out” using the hash character and the ASCIIOUTPUT has been added on the next line. Planning Analytics/TM1 will create a text file named “Jims_file.txt” in the DATA folder (if you don’t have access to the DATA folder be sure to prefix the filename with a valid path). Since ASCIIOUTPUT only works with STRING values, we used the STR function to convert the numeric value in “nValue”. Each of the other values (nModel, dMonth, dYear and dAmount) are also written on the file. If after running your process with the ASCIIOUTPUT you can’t find the file, make sure you are looking in the correct location (in our example it’s the DATA folder) and again verify that the DATA procedure section is being executed.
Why not try the Process Debugger?
In Planning Analytics Workspace release 2.0.84, a TurboIntegrator Process Debugger was introduced (to check your release number try this). To access the debugger, the configuration parameter EnableTIDebugging must be set to TRUE (by default, this parameter is set to false, for more information on changing configuration parameters, see Set database configuration parameters.). You can utilize the process debugger to set “line breakpoints”, and then “step through” your process checking the logical flow and the value of your variables “at the moment”.
A Short Test Drive
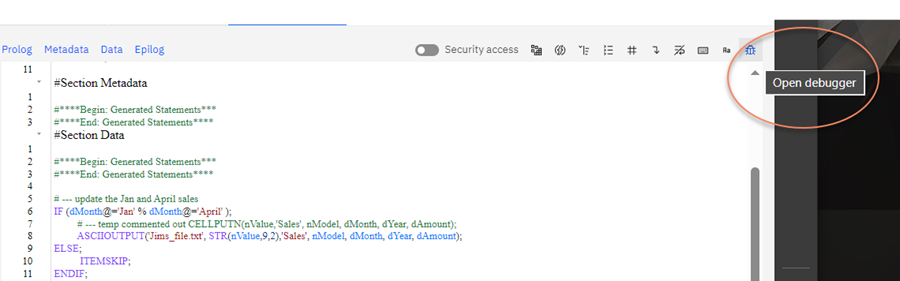
Let’s test drive the debugger. In Planning Analytics Workspace, right click on a process and select Edit Process, then, in the toolbar, click the debugger icon. This will open the debugger panel.
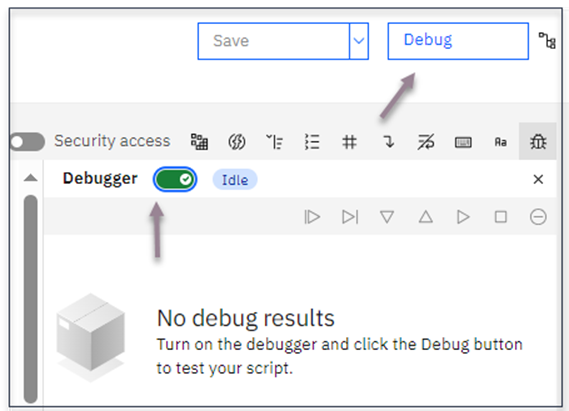
In the Debugger panel (shown below), switch the Debugger toggle to enable debug mode (notice that the Run button changes to “Debug”):
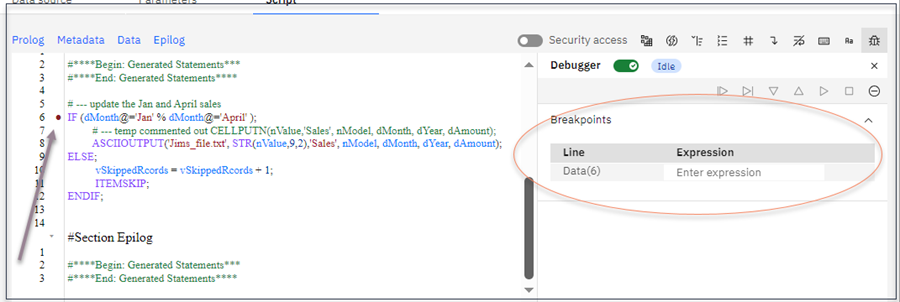
Now we are ready to set a line breakpoint. By clicking a line number in the code editor (I clicked line number 6). The Breakpoints section will appear in the debugger panel and in this section, you can see the line of code for which breakpoints are set up. In this case only 1 breakpoint is set on line 6 of the Data procedure section:
To start debugging, you can click the Debug button. The debugger will stop on the first executable line of your process (in this simple example, it is the same line that our breakpoint is on). As the execution stops, notice that the debugger panel now shows a Variables section that lists each of our variables and their current values:

During debugging the Continue, Step over, Step in, Step out, Continue to end and Stop execution buttons are enabled, and you can use them to manage the debugging session. Whenever the debugger pauses, the Variables section is updated to show all the variables along with their values (at that moment).
This example is simplistic – in that it only “brushes the surface” of what the new Planning Analytics Workspace TurboIntegrator Process Debugger can do (I particularly like that the process debugger supports debugging a sub-process of a parent process!). You can read more in the debugger here.
Want some more Debugging Tips?
If you’d like some help debugging a specific TurboIntegrator process or want a kickstart session with the Planning Analytics Workspace TurboIntegrator Process Debugger you can reach out to QueBIT at any time for assistance.