
In earlier posts, we outlined how you can use the IBM Planning Analytics Monitoring dashboard within Planning Analytics Workspace (PAW) administration to track the health of your host environment as well as individual databases. In this post we aim to breakdown the detailed database activity report which is available when you click the database name of an individual tile of any running database appearing on the dashboard. If you used a utility called TM1TOP in a prior version of IBM Planning Analytics or IBM Cognos TM1, this will look very familiar!
The Grey Bar
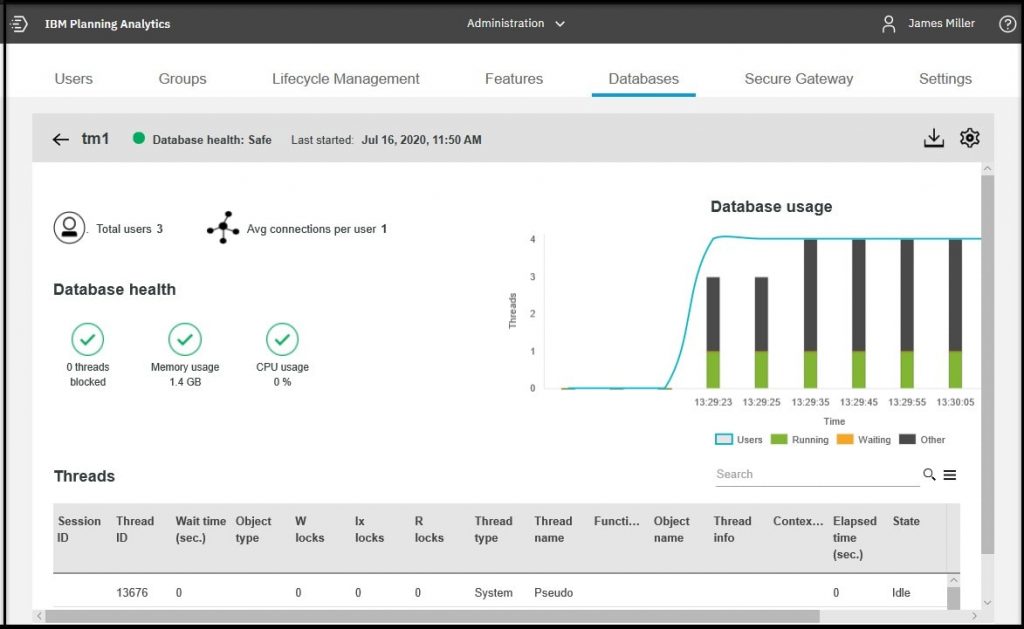
Across the top of the “report” is a grey bar containing the Database name, the current health state (of the database), the Last date and time the database was started, the Download logs icon and the Database settings icon.
Obviously, the database name is the name of the database you selected. The (current) health status is based upon the set thresholds and the current usages. The Last started / stopped date and time is the most recent database start or stop initiated directly through the Planning Analytics Monitoring dashboard. It is important to note that if a database is started or stopped in any other way (for example through IBM Cognos Configuration) those times are not reported.
Accessing Database Logging Information
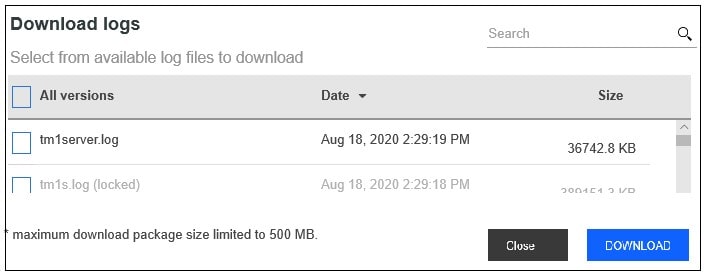
Also, on the “grey bar” is the Download logs icon. Clicking on this icon displays the Database logs dialog (shown below) where you can search for and scroll through the list of available logs that were generated by the selected database, select one (or more) and click the DOWNLOAD button. This is a useful feature since it allows you to easily access logging information without having to connect via MS Windows Remote Desktop Connection (RDC) and navigating to the logs folder.
Database Settings
The Database settings icon (also on the grey bar) allows you to set configuration parameters that determine the behavior of your databases. When you click on the icon, the Database settings dialog (shown below) is displayed where you can locate the parameter you want to modify.
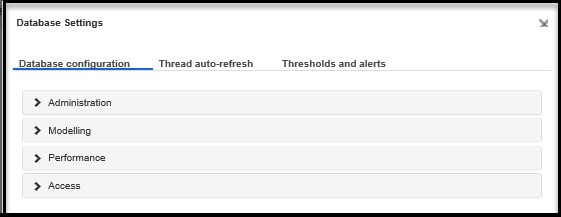
All of the configuration parameters are sorted into Administration, Modelling, Performance, and Access categories, and then by function. Each parameter includes a description, along with an indication of what the default value is for that parameter. For example, under Default, PerfMonActive is typically set to true to make sure that TM1 internal performance counters are continuously updated. Don’t worry if you see a blank value displayed for a parameter value; blanks are the same as a true value.
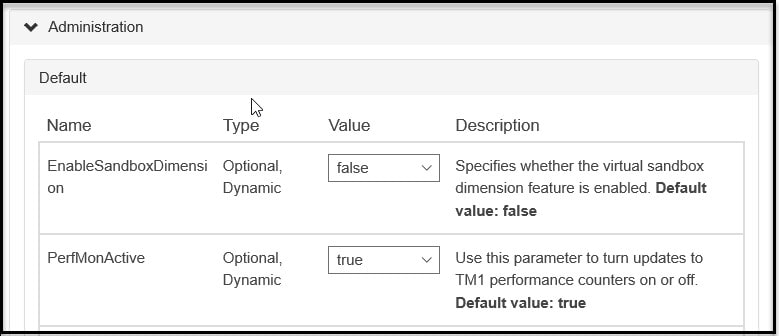
To review all of the detailed information for each of the database configuration parameters, you can click here to review the “Parameters in the tm1s.cfg file” section of the IBM Support Knowledge Center (or call QueBIT).
Total users and Avg connections per user
The report also shows the number of currently connected users and the average number of connections per user, along with database usage metrics. Hint: Keep an eye on the connections per user number, as more than a few connections per individual user can affect overall database performance. If you experience this, give QueBIT a call to help diagnose the cause:

More Information
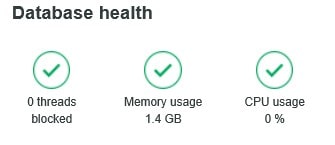
The database activity report also provides the database health indicators; “threads blocked”, “memory usage” and “CPU usage”, are displayed with appropriately colored icons. The memory usage and CPU usage “health” are straight forward in that their health is indicated by the correlation of the established resource usage thresholds and the current resource usage.
For “Threads blocked” you need to understand 2 distinct things: 1) what is a thread? and 2) what does it mean when a thread is “blocked”?
A thread is a request to the Planning Analytics server to perform some work, typically a query such as a user opening a view, or it could be a TurboIntegrator process performing some sort of processing, rule calculation refreshes, or even a user logging in, etc. Threads are identified with an ID, Type (user, worker, chore, system) and Name.
A “blocked thread” is bad, mostly because the Planning Analytics server cannot complete the request for some reason and the thread is “waiting”. Typically (hopefully!) blocks eventually “clear” and the thread completes within an acceptable period of time, however, in some cases, due to a variety of reasons, blocked threads can cause more threads to become blocked and then you’ll have a larger problem. Some blocking is normal, but if blocked threads becomes routine and “wait times” are becoming longer, you have to determine the root cause (again, QueBIT has plenty of experience in this area and is ready to help).
Next Time
The database activity report also includes a usage visualization and a threads table which can be further used to analyze usage over time. In my next post I’ll dig into these.
Ask QueBIT
Are you having trouble understanding your IBM Planning Analytics database activity? The experts at QueBIT are happy to discuss your needs. We’re here to help! Contact us here.