
IBM Planning Analytics Administration includes the ability to monitor and administer your databases from the Planning Analytics Monitoring dashboard (as long as you have administrator access to use the dashboard).
Note: This information applies to Planning Analytics running in the IBM Cloud Environment.
First question, what exactly are we referring to when we say, “a Planning Analytics database”? A Planning Analytics (or “PA”) “database” – also sometimes called an “instance” – is the cubes and dimensions, the attributes, the Turbo Integrator (TI) processes, reports and dashboards, etc. that “make up” a particular PA server, running in a host environment (or on a “system”). The host can be either physical or virtual and can potentially run more than one PA database or server.
To access the dashboard, navigate to your Planning Analytics home page (see your Welcome kit for the exact URL), log in using your IBM ID and password and then click on Administration.
The Planning Analytics Administration page opens, from there, click on Databases to see the dashboard:

The Analytics Monitoring dashboard lists the databases that are available on your “system”, along with important performance metrics for each database. Each database will appear in the dashboard as an individual “tile”.
In addition to showing information on each of your databases, the Planning Analytics dashboard also shows the status of the total system resources on the host environment where the databases are running.
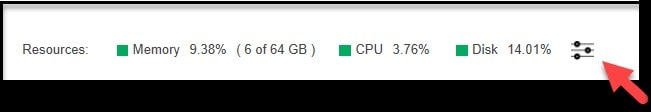
Memory, CPU, and Disk usage are displayed, showing the percentage of available resources currently used on the system. Each metric is accompanied by a color-coded square, indicating if resource usage is at the safe, there a concern, or critical level, a sample is shown below (hint: green is good!):

Start Here
If you are just getting familiar with the “art” of monitoring planning analytics database, a logical first step would be to routinely review the “health” of the host environment in its entirely (not each database). The reasoning is that if the environment isn’t healthy then any databases running in that environment may be “in peril” (of course, just because the environment is fine doesn’t guarantee that the individual databases are okay, but more on that later).
As with the individual databases, planning analytics gives you the ability to define how Safe, Concerned, and Critical “relates” to your “pool” of available resources. This is done by establishing thresholds.
Once thresholds are set, planning analytics will check the available resources and determine its current “state”: based upon the resource thresholds, when a system resource is in a safe state, the square for the resource is green, if a resource is in a “concerning” state, the square shows as yellow and when in a critical state, the square is red.
Set your Thresholds
Thresholds are just another name for “limits” or defining the tolerance for running on a limited level of resources.
Using these limits, you can define the amount of available resources required for the safe, concerned, and critical states of three important system resource metrics: Memory (in GBs), CPU (as a percentage of total CPU capacity on the system) and Disk (as a percentage of all system disk storage).
In other words, when resource usage falls below the Warning threshold, the resource is considered to be in a safe state; when resource usage is at or above the Warning threshold but below the Critical threshold, the resource is in a warning or concerning state and finally, when resource usage is at or above the Critical threshold, the resource said to be in a critical state.
To set these thresholds, you click the icon to the right of the system resources indicators on the Planning Analytics Monitoring dashboard:
When you click on the icon, the Agent configuration dialog (shown here) is displayed:
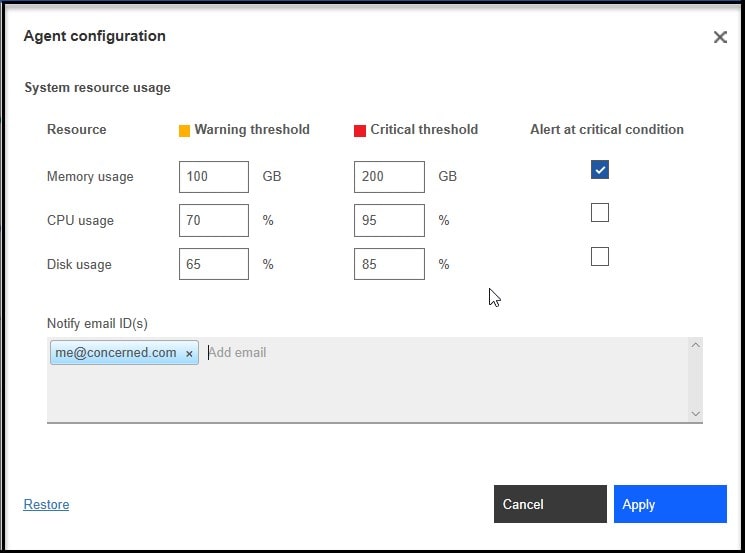
You can enter limits here and click Apply (or Cancel to not make any changes). Keep in mind that setting these system resource thresholds here does not impact or change the amount of available resources of your host system; it merely determines how the actual resources usage being consumed corelates to the perceived “operating state” or “health” of the host, at that time.
At first, you may want to be conservative and set your thresholds on the lower side to “get a feel” for how resource usage effects your server or databases, then “move up” or increase the limits as time goes on.
Don’t Worry! You can click Restore at any time to restore the default threshold and alert settings and to find what the recommended threshold defaults and related information are, you can go to: https://www.ibm.com/support/knowledgecenter/SSD29G_2.0.0/com.ibm.swg.ba.cognos.tm1_prism_gs.2.0.0.doc/t_set_system_resource_thresholds_and_alerts.html.
Finally, also on the Agent configuration dialog, if desired, you can check the “Alert at critical condition” checkbox (and provide a “Notify email ID(s)” which will result in Planning Analytics automatically notifying you whenever any of the monitored resources reach a critical threshold.
Now that you understand how to monitor the health of you host environment, what about individual database monitoring? Well, that’s for next time.
Ask QueBIT
Still confused? Have a question? No worries! You can always reach out to your friends at QueBIT for assistance. We’re here to help!