
Users commonly ask if they can sort their data by ascending or descending order when viewing in a HTML report. Unfortunately, the answer is NO. How you set up your rows in a HTML report is how they will display once the report is run.
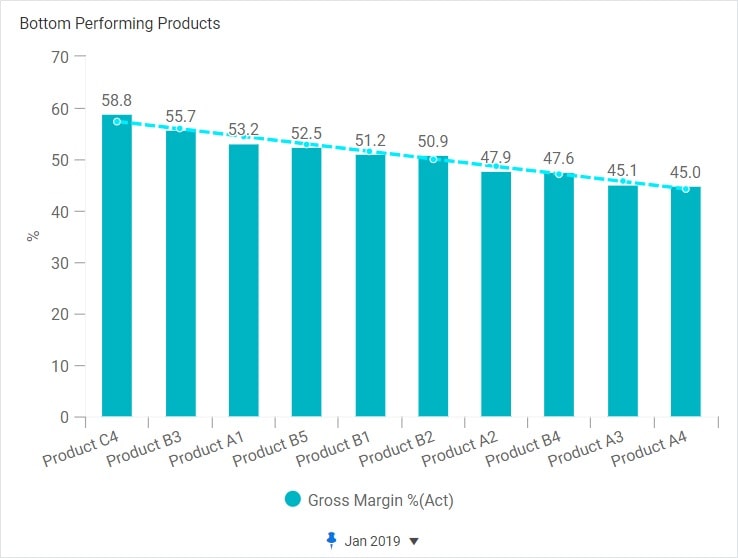
However, Dashboards do allow users the option to sort data, and even limit the data to the top or bottom X or X% of a dimension. Maybe you’re interested in seeing the top 5 clients by revenue, or you are curious which 10 products yield the lowest gross margin…
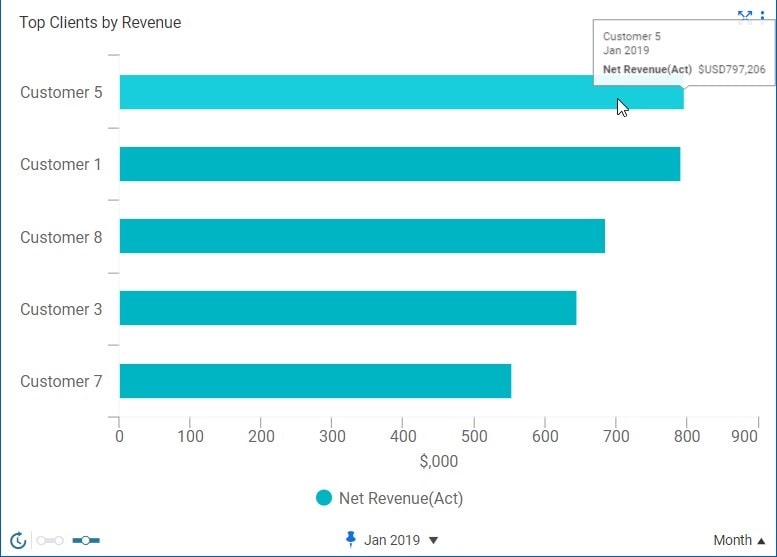
To best take advantage of Dashboard’s sorting and limiting features, it is recommended to use Column, Line, Area, or Bar charts.
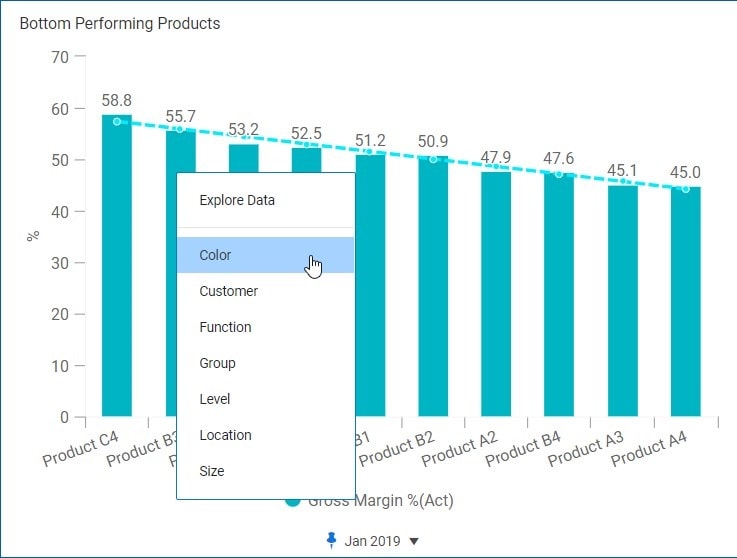
Under the Account Data settings, you can also filter the data further by Levels, Attributes, and Dimensions. Maybe you only want to see your top performing clients in a certain Profit Center, or you want to know which products in a specific product line are not reaching their potential.
Customize your charts further by adding trend lines and data labels.
And don’t forget the drill down features to dive deeper into the data!
If you’d like more information, please contact us. QueBIT would be happy to help with any reporting or other needs.