
Planning Analytics – Step by Step Consolidations
What is Consolidation?
In Planning Analytics/TM1, dimensional elements that represent aggregations are called “consolidated elements” or consolidations (business users may also refer to them as “groupings”).
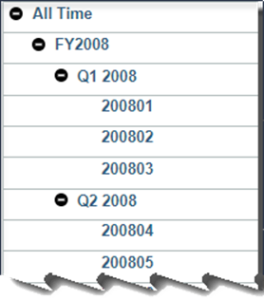
The following image shows three levels of consolidation for elements of a Period dimension. The months (200801) provide the lowest level of detail (or Level 0). Groupings also exist for Quarters (Q1 2008) and Fiscal Years (FY2008) and a “top level” grouping also exists for housekeeping (All Time):
Where is the Data Stored?
The data you import into a cube provides a snapshot of your business at a specific level of detail. Using this example, you may import sales data at the monthly level and the dimension elements that identify these data points are simple or leaf-level elements in the dimension: i.e., sales for one month. By using consolidated elements, you can easily aggregate numeric data into categories. In this case, we have quarterly elements (that sum quarterly sales amounts) and Fiscal Year elements (that sum sales amounts for the year).
Subset or Consolidation?
Planning Analytics/TM1 also provides Subsets. A Subset is a “specific selection of elements” from a dimension. IBM describes a subset is a “limited version of the parent dimension”. Again, using the periods example, what if we could create a subset of the monthly elements that make up each quarter? If you are intending to have the subset produce an aggregation, it won’t, because the objective of a subset is to assemble a sort of “pick list” to save mouse-clicks when reporting – NOT to aggerate the values of the elements.
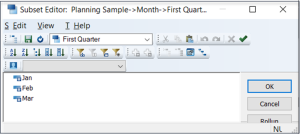
To illustrate, below we can see that a user has created a subset named “First Quarter” consisting of the months Jan, Feb and Mar. Selecting the subset produces a “pick list” of just those months:
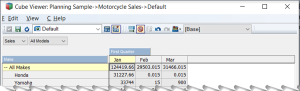
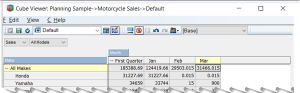
But the resulting cube view does NOT aggregate the sales values of Jan, Feb, and Mar:
Using PAW to Consolidate
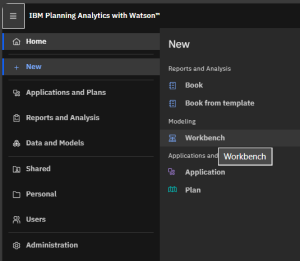
You can edit dimensions with the Dimension Editor in PAW if you have Modeler or Administrator access. To create a grouping (consolidation) in the period dimension (using Planning Analytics Workspace or “PAW”) I prefer to use the modeling workbench (if you are unfamiliar with workbenches, you can read about it here), so you can click on the Home menu, then click New and Workbench (shown below). Note: if you don’t care to use a Workbench, you can access the dimension editor directly from the Data Tree.
From there, expand your database (on the left panel), expand dimensions, find and right-click on your dimension and select Edit dimension (I am using the dimension named “Period_For_Testing” for this exercise):

The subset editing panel will open (shown below). You can click on the Add root member link on the far right:

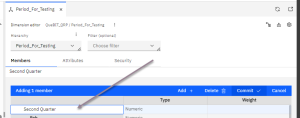
You will see the highlighted “Adding 1 member” banner highlighted and can enter the name we want to give to our consolidation, such as “First Quarter” or “Second Quarter” into the provided textbox:
Click on Commit:

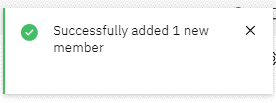
Planning Analytics will add the new element (member) to the dimension and give you the “Successfully added” message:
Now you must define which elements you want to aggregate in this new grouping. You can scroll through the list of elements in the dimension, right click to select them and then click Copy:

Once you have selected the elements, you can find your new grouping element, select it, and then click Paste, and As a child (this establishes the “Parent-to-Child” hierarchy relationship between the elements).

Always make sure to confirm that the new groupings look like what we expected:

The last step in our little exercise is to see the expected result in our cube view – that the grouping “First Quarter” is an aggregation or “sum” of Jan + Feb + Mar sales:
Wrap Up
If you are wondering if there is another option for creating an aggregation of values without editing the dimension, there is. For example, you have the ability to enhance most any PAW view with various calculations – within the interface – without having to create a cube rule (or edit the dimension) which you can learn more about here, but for “common” groupings that most users will want (like for quarter or year) you would want to create them by editing the dimension.
Some things to look out for when adding groupings to a dimension include:
- Be careful when editing any dimension; we would advise you “prototype” any dimension maintenance in a development environment first and then promote the validated results to your controlled or production environment to avoid incorrect results or even loss of data
- Always consider model security. For example, element security may be applied to the dimension you are editing, how will your edits affect the security?
- Have an understanding of the default views used in the model and consider how groupings may enhance or otherwise modify them.
- Finally, before you go ahead and add any new groupings, it is always a good idea to examine the model to determine if any existing groupings (or other features, like a summary calculation) within the model already supply the functionality (in full or in part) that you are looking for. Avoid the ‘just add it” mindset to keep your model clean and performing well.
Confused or Interested in learning more?
Do you need to add some common groupings to your exiting dimensions to simplify reporting or are you interested in enhancing your IBM Planning Analytics Workspace views using summary calculations? Maybe you want to learn what “keep your model clean” involves? If so, Contact QueBIT today. We would be happy to discuss your needs and offer recommendations.