
The power of IBM Planning Analytics (PA or TM1) comes from its ability to receive input information from different users, take that input and, through rules embedded in the model, consolidate a forecast (budget), or demonstrate variances to actuals.
As developers working with PA we have to build models that perform well in the back end, but we also should not forget about what we put in front of users. Screens that require input from users need to be intuitive and easy to use, not only to save time but also to help them avoid input mistakes.
IBM Planning Analytics Workspace (PAW), the web interface for IBM Planning Analytics, allows us to set conditional formatting on screens (cube views). In this article I will describe a way to set conditional formatting on a view that will be used for data input. The goal is to create a screen that makes it easy for a user to identify the cells they can update.
The following steps describe the pieces that will work together to accomplish the goal. In our example we need to clearly identify months that are Actuals vs. months that are Forecast, so users will intuitively enter data for the forecast months:
- The first piece we need is a Relative Time or a Time control cube somewhere in the model that can flag which months are actuals vs. forecast. This cube can take many forms depending on the design of the model. In this example it takes the following form:
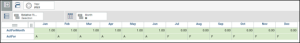
We see months of Jan through Jun of the year 2022 are flagged as Actual months and the rest are Forecast months. This is a control cube that is usually not visible to end users.
- We also need a measure in the Reporting cube (i.e., the cube to which users will enter data) that will look up the Relative Time cube and flag the cells based on the Actual/Forecast value. This will be done via N-level rule:
![]()
The measure Input Cell Highlight has only one condition for allowing entry, that is the ActForMonth flag should equal 1 for Actual months.
- We now go to PAW and create a Book with a view from our Reporting cube. In this example, we want users to input Units Sold in forecast months only. The measure to which users will input must be in the Rows or Columns of the view.
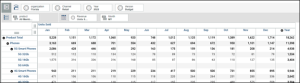
As we can see, the default formatting from the view does not show clearly which cells are for input and which ones are not.
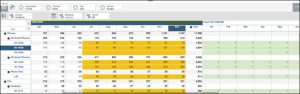
- To set up the conditional highlight, we need to bring the measure Input Cell Highlight into the view to use it for highlighting. Our report will temporarily look like this:
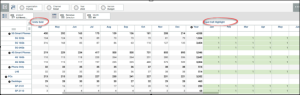
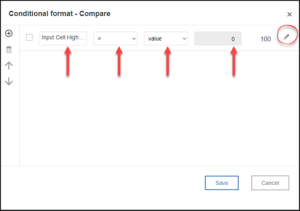
- We will remove the Input Cell Highlight But first we need to set the conditional format of one measure based on the value of another measure. We right click on Units Sold and select Conditional Formatting.
.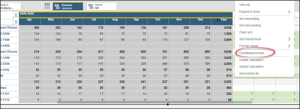
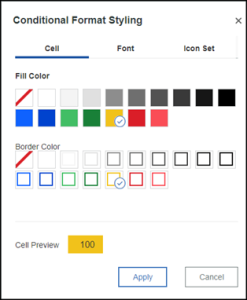
- On the next screen we select Input Cell Highlight as the comparison measure, select a Fill and Border Colors and click Apply
- Our view now looks like this:
- The last step is to remove the Input Cell Highlight measure from the view and save it.
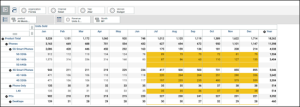
This screen shows a view where a user can easily identify the cells that are where their input is required. This method also ties into our relative time cube; therefore, the cell highlighting will roll forward with the forecast months.