
Here’s how to toggle between hiding and showing parts of a report
Custom Controls, a new capability with release eleven, easily enables the report author to add Java Script to the report, thus providing an enhanced user experience when rendering the data in HTML. As long as the report is running in full interactive mode, the author can add abilities such as (1) Hide and show lists or (2) Create an application bar to switch between lists or (3) Add customized charts and crosstabs. IBM provides many more sample scripts with the installation not detailed in this article, so I suggest you ask your administrator for a copy of the scripts so you can see what is available with your installation. Another option for authors with java scripting experience is to develop your own. The possibilities are endless.
For this article, we are going to use one of the java scripts provided with the installation. In the example below, we will modify a report which includes both a detailed list and summary to allow the user to toggle between showing or hiding the detail as needed.
Business Case:
The City of Boston currently utilizes a “311 System”, which enables city residents or city workers to easily report non-emergency issues. Items such as broken streetlights or graffiti can be reported to the proper city services department via mobile phone applications, online, social media or a phone call.
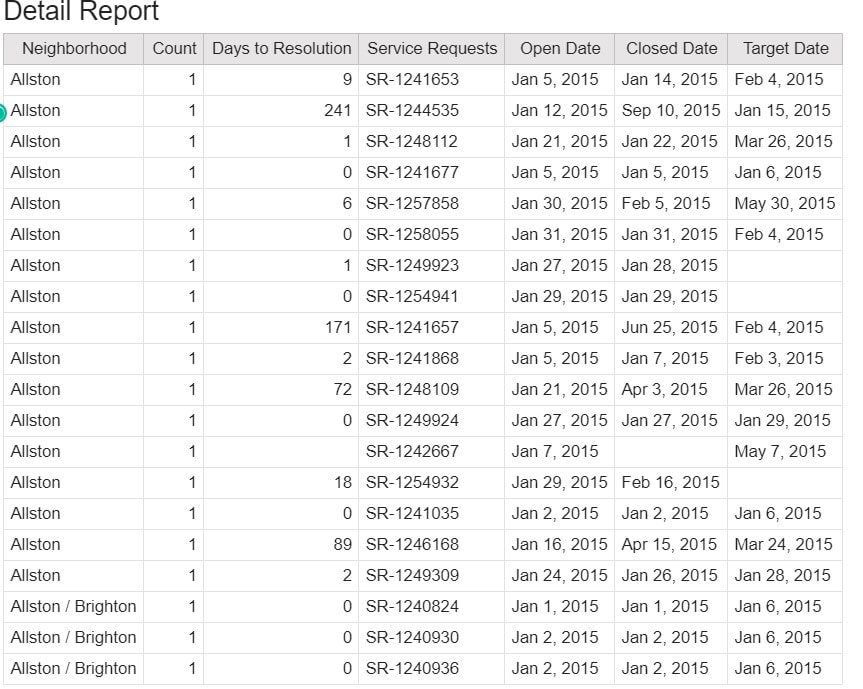
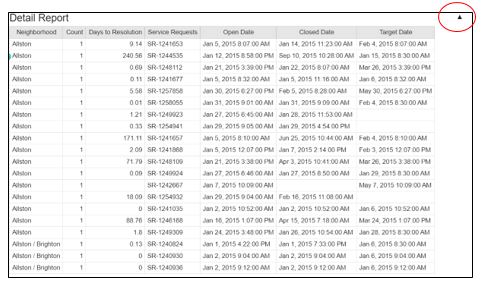
Below is a two-part report used by the City. The first section is a simple list report which shows the total count of issues and the average days to resolution by neighborhood. When viewing a one-month period, the report is over 900 pages long. Below is a snap shot of the first page.
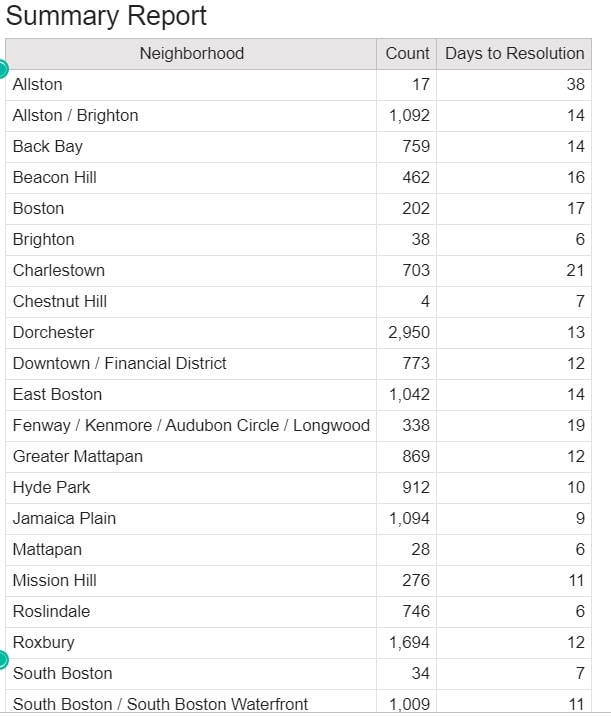
The second half of the report is a summary section showing the same data without the service request detail.
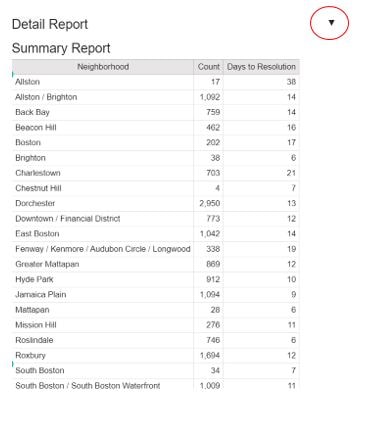
Once we are done adding the custom control, the user can toggle between showing and hiding the detail report as shown below using the little toggle arrow to the right of the report name.
Procedure:
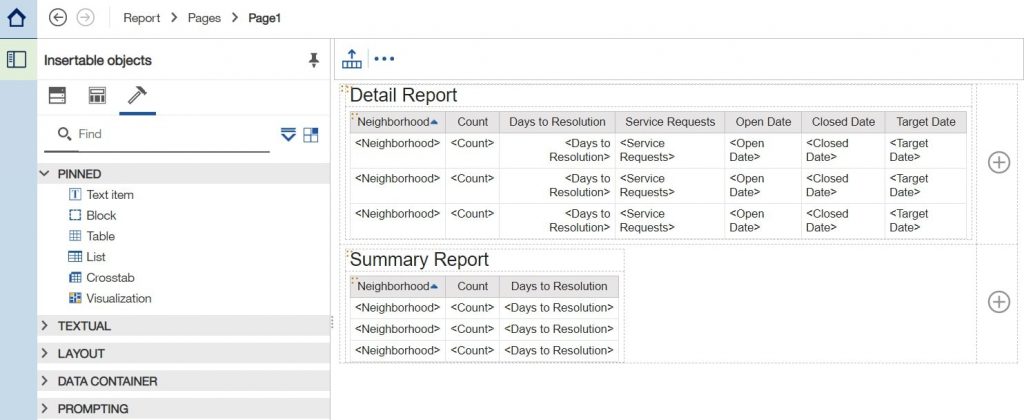
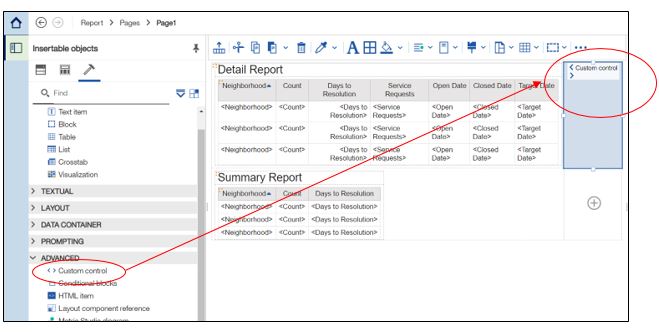
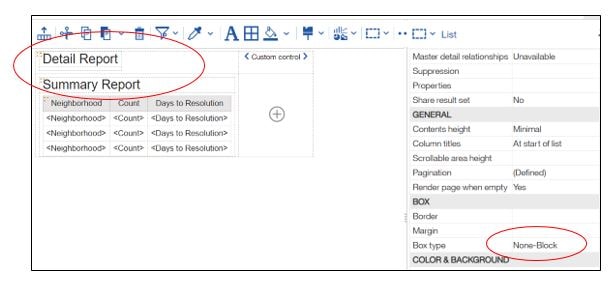
- Create a report with two lists, one for the detail and one for the summary. I suggest using a table with two rows and two columns for ease of design. The two lists will go into the left-hand top and bottom table cells. Below is what you should see before starting work on the custom control.
- To add a custom control, from the toolbox under ADVANCED, drag the Custom control icon to the report. Specifically, into the upper right corner table cell.
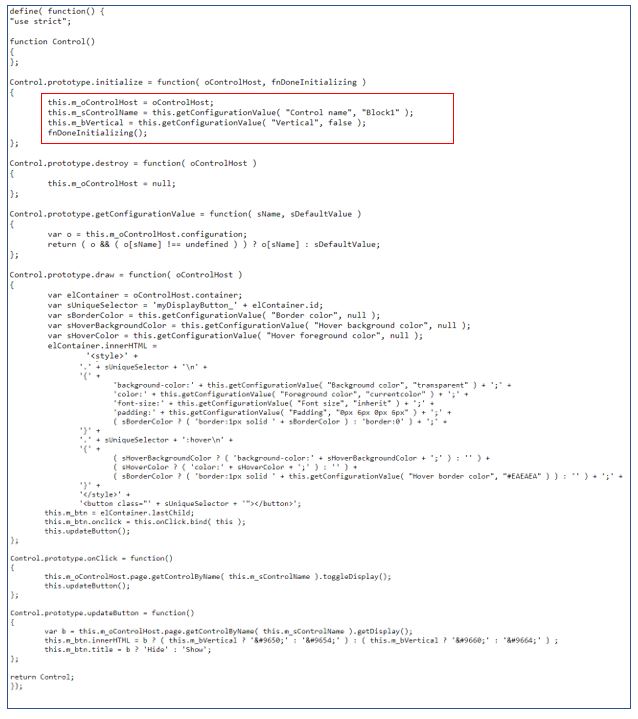
- Below is the java script provided with the install, C_DisplayButton.js. It enables the use of the up/down arrow toggle button shown above and will be the one we reference for this example. Please note the parameter values the script is expecting. This will be important further into the process.
- Select the custom control and click the Show properties icon.
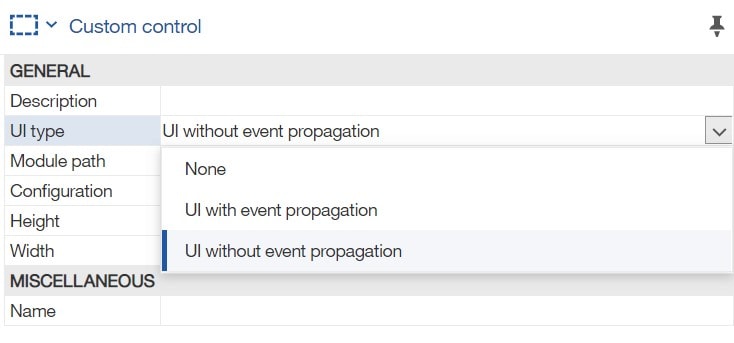
- To specify how you want the control to interact with the report, click the UI type property. If you do not want to render an interface, set the property to None. If you do not want events, such as mouseup, to propagate from the control to the report, set the property to UI without event propagation. If you want events to propagate to the report, set the property to UI with event propagation.
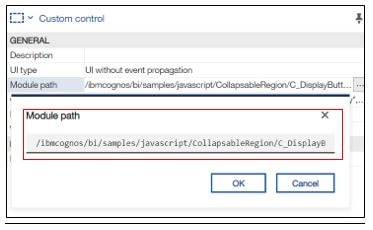
- To specify the location of the file, C_DisplayButton.js, which we will be use for the control, click the Module path property. Note, ensure your administrator has installed the files, and you reference the path correctly. In my setup, my sample scripts are under the <cognos analytics path> webcontentbisamples. I’m using path: /ibmcognos/bi/samples/javascript/CollapsableRegion/C_DisplayButton.js
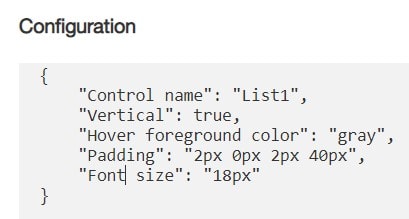
- To add JSON that configures the custom control, click the Configuration property. Note, the control name is the object you are referencing. This is case sensitive, so ensure you cut/paste the proper name here (i.e. list1 vs List2). For my example, I’m referencing List1 (My Detail list). Provide the remaining configuration elements identified in the java scripts. (See script reference above).
- As stated above, this will work when rendering the report in HTML. To test, run the report now. You should see the following report. Notice the toggle button!
- With this report, however, I want the report to default to not showing the detail list when first run. Since this is a toggle, it is very easy to do. Go back to edit mode and set the properties for List1 (Detail Report) to “Box type= None-Block” to ensure the detail list is closed when the user first enters the report.
When run, you will come into the report with the detail hidden, as shown above.