A sparkline is a tiny chart that provides a visual representation of data. You can use sparklines to show trends in a series of values, such as seasonal increases or decreases, economic cycles, or to highlight maximum and minimum values. Sparklines are typically positioned near its data for greatest impact.
Google search and you’ll most likely find “tips” on how to use sparklines with your Planning Analytic data, using Microsoft Excel. But there is another option.
A Practical Illustration
Gross Gaming Revenue or GGR (also called game yield), is a key metric used by gambling and betting companies to determine which type of table game might generate the highest revenue. It reflects the difference between the amount of money players wager minus the amount that they win. GGR is calculated as:
Gross Gaming Revenue = (Total Wagered – Total Winning Payouts) / Total Wagered
Suppose in an IBM Planning Analytics model we have a Table Games cube where GGR is calculated for each table game, over a rolling time period of thirty days.
We will assume that it is a “simple” cube in that it is made up of only three dimensions: “Table Games”, “Periods” and a measures dimension. In this cube the total wagered and winning payouts are captured daily and with those amounts, GGR is calculated in real-time by means of a cube rule, perhaps something like the following (there is a FEEDER, I just didn’t show it here):

Which shows in a simple view something like this:

Rather than using Excel and pulling this information into a Planning Analytics for Excel (PAfE) report, suppose we use the D3 libraries to produce dynamic sparklines on the GGR data, without any fancy programming? To do that, all we need is a simple HTML document that references the D3 libraries. This will be our “presentation layer”.
The HTML template looks like this:

You can see the script inclusions that are required for style (sheets), the D3 JavaScript libraries, and our data. There is one other import reference required to make this all work, and that is the DIV tag.
HTML Content Division Element
This particular D3 visualization uses an HTML DIV element as a “container” for the sparklines. The HTML Content Division element ( <div> ) is a generic container for flow content. It has no effect on the content or layout until styled in some way using CSS. Notice the line “<div id=”graph” class=”aGraph sparkline-container”></div>” above. The D3 libraries will write the content to the DIV named “graph” (using a style sheet, you can position or change the appearance of the output generated pretty easily!).
Setting Up the Data
As I have demonstrated in other posts, the data can be pulled from a source system (in this case Planning Analytics), formatted, and saved as a file (here it is spark_data.js) where it can be used by the D3 scripts.
In recent examples I have used Python to query and format data. In this example, a simple TurboIntegrator process was used with a cube view data source, writing to a simple text file using the ASCIIOutput function. In addition, the local variable “DatasourceASCIIQuoteCharacter” needed to be set to an empty string in the Prolog section of the process lie this:
DatasourceASCIIQuoteCharacter=”;
The “trick” here is to understand that the data must be “dynamically setup” as a JavaScript object that the D3 libraries will read:
Var data = {}
The records for each table game (like Baccarat or Blackjack) will be defined in our data object with a unique key and thirty data points, separated by commas. Below is an example showing just one table game key:

Viewing the Result
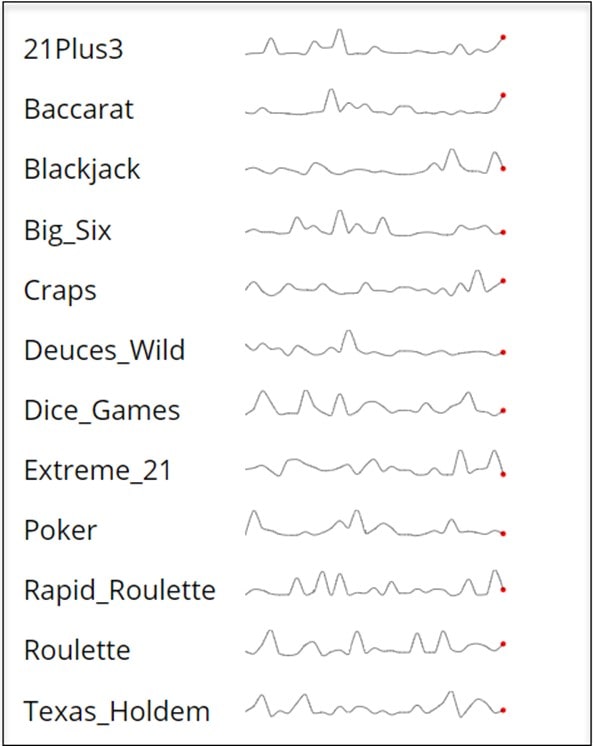
The sparklines are generated upon loading the HTML page in a Web Browser (based upon the Planning Analytics data):


Conclusion
In this example you can see that it is possible to utilize sparklines as part of a Planning Analytics data visualization without using Microsoft Excel and with very little “programming”. You can experiment with style sheets to create the exact look you want, perhaps part of a KPI dashboard or as an autogenerated email and once setup, you can use this solution over and over without the need for modification.
