
For those of you in the Planning Analytics (PA) world – Have you used any MDX lately? (MDX=Multi-Dimensional Expression). The goal of this article is to help you spot additional opportunities for MDX to assist in everyday analysis, reports, and extracts out of a PA model. This is a follow-on to an earlier Knowledge Base article on MDX and dynamic views. MDX is a term that is thrown around more often now with Planning Analytics (PA) since it is a key component in content from PA for Excel and PA Workspace.
How can MDX “assist” you might ask? The main answer is that MDX gives you more flexibility – – to build an expression just one time & have it be self-updating, so that it always provides the latest filtered information. You might think it will take too long to get the hang of MDX, and never get around to any real-world application of it. If that is the case let this article launch you straight in with a helpful example and other suggestions. It will give you the foundation to be hands-on and more quickly build or adapt dynamic set filtering expressions.
MDX can define different building blocks for dimensions or cube data to specify lists or intersections of data respectively. Dimension examples of MDX are: dynamic sets (subsets) and Dynamic Report row expansions.
In this example, we want an MDX-based set to refer to a lookup-value in a PA cube as a starting point. Then we will take it a step further to define the set as the Level 0 descendants of that lookup value.
- Cube for lookup: Global Variables
- Cube lookup Value intersection: Plan Year (global variable) at String (measure)
The dimension where we need to filter the set is a time period flavor used in analysis, reporting, and extracts. This example relates to a model that has a Plan Year value input in its Global Variables cube.
- Dimension to filter: Period Weeks
- Elements for set: weeks (of the Plan Year)
Note that this particular example can be easily adapted for lookups such as Current Year or Budget Year (or any Current Quarter or Month rollup of weeks). Later in the article some other adaptation suggestions will get you thinking about more ways to leverage this filtering!
We will begin working in PAW in the Reports & Analysis section.

The next step is selecting Create > Book to bring up a canvas & access the model objects.

This will automatically put us in Design Mode. Next is a click on the Databases to scroll among the various dimensions.
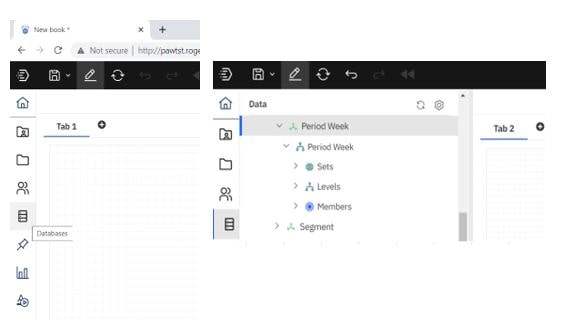
Our goal here is to create a new Set so we will begin by right-clicking on the Sets item underneath the Period Weeks dimension name. Then hover to the right of Sets & click on the 3 dots that appear.
![]()
We then get a pop-up of two options & will click the Create Set option to open the Set Editor window.
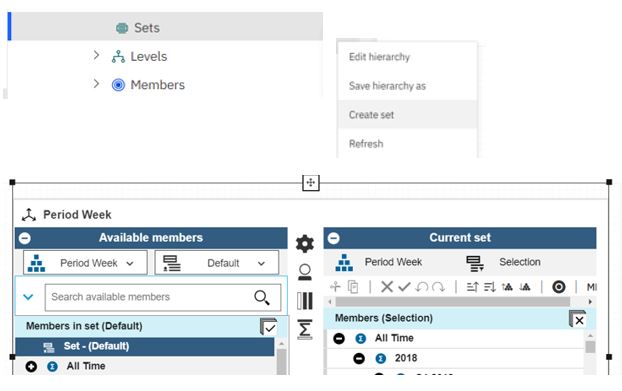
In the Set Editor, Click on the MDX button in the Current Set pane on the far right.
![]()
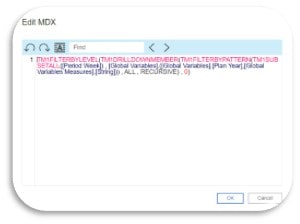
We will be using this expression:
TM1FILTERBYLEVEL(TM1DRILLDOWNMEMBER(TM1FILTERBYPATTERN(TM1SUBSETALL([Period Week]) , [Global Variables].([Global Variables].[Plan Year],[Global Variables Measures].[String])) , ALL , RECURSIVE) , 0)
Reminder: it is best to copy-paste plain text into PA (not directly from the web or Microsoft Word, for example)
In the Edit MDX window that opens, type (or paste) the expression and click OK.
As with every MDX expression, syntax is critical (getting all the parentheses, brackets, commas, and dots) in the right places). Fortunately in PAW the Set Editor the syntax doesn’t need the additional syntax of curly brackets that we typically have when working with MDX in Architect or as cell text in PA for Excel.
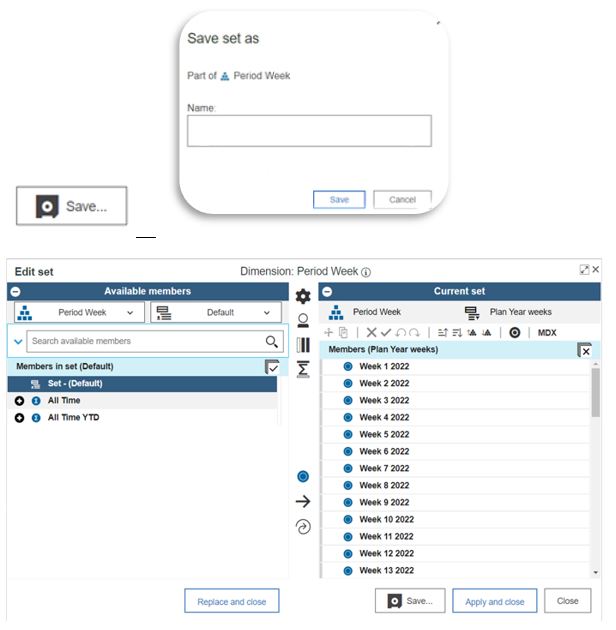
From the Current Set pane in the Set editor, the dynamic set is then saved under the name “Plan Year weeks” by clicking on the Save button. And in the Set Editor we see the resulting filtered list.
For those curious about how to understand how the nested parts of the MDX expression work, here is a brief breakdown of the functions and their arguments. We will start at the outsides of the expression (beginning and end) and work our way inward.
TM1FILTERBYLEVEL( filters the expression that follows, and it uses the 0) argument at the end which tells us this will filter or keep just the Level 0 items.
TM1DRILLDOWNMEMBER( expands out whatever named parent element is defined by the expression that follows and it uses the ALL, RECURSIVE) arguments to look at All descendants of the rollup and Recursive means to expand out any rollups that occur under the named parent.
TM1FILTERBYPATTERN( provides the value to match to according to the expression that follows.
TM1SUBSETALL( [dim name] gives the pattern matching a starting range of elements to filter among.
Finally, the remaining expression (here it is for a cube intersection) defines what the parent element match or pattern-match will be:
[ cube name ].([ dimname1 ].[element] , [ dimname2 ].[element]
The above example provided another flavor of using MDX to filter the “frame” of a data view based on a dimension – -in this case all the weeks of a Plan Year. MDX filtering doesn’t stop there.
As promised, we’ll now consider some other ways that the above example can be adapted. Does your model have other types of Global Variables or various Assumptions? Numeric values in lookup cubes could be useful in filtering to help focus your analysis, reports, or extracts.
Perhaps your model sets a threshold rate assumption (for example a tax rate) and for a Sales Revenue view, you want to list out Regions that carry a lower tax rate than the threshold. Another case might be where you want a view of the forecast and which accounts have been planned above a certain annual materiality threshold. As you can see, there are many ways to leverage MDX in PA. For some pointers on the threshold type of MDX expression, do check back in the QueBIT Knowledge Base for an upcoming article.