“OK, I have a data dump. What is this supposed to tell me?
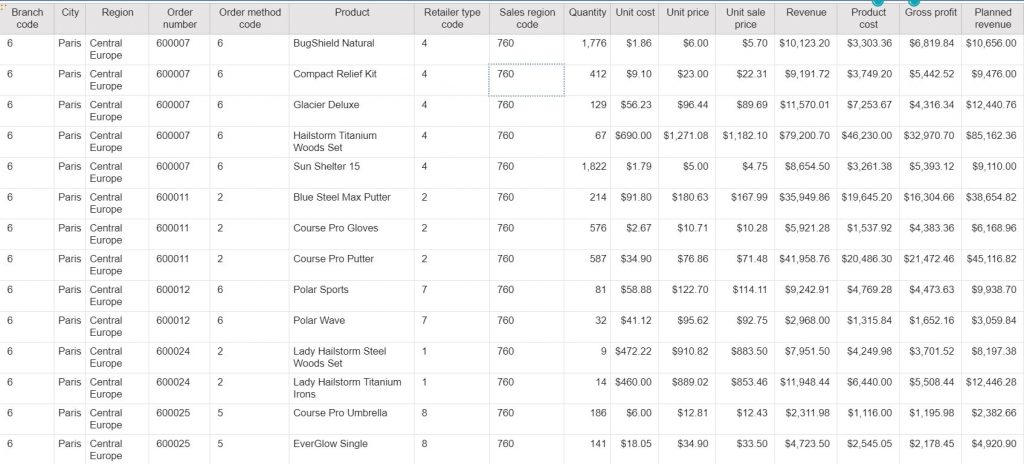
The example above shows sales information by product. However, this report is no different than a spread sheet. Sure, I can dump the data into an Excel Pivot table, but it is time consuming and fraught with human error. I want the report to give me the information without me having to dig for it. For example, what if I want to identify products where I did not forecast revenue as well as I hoped. This is where conditional formatting can play a key role, as it allows CA to highlight items that fall out of a certain range I’m concerned with. Below are step-by-step instructions on how to add conditional styling to this example report.
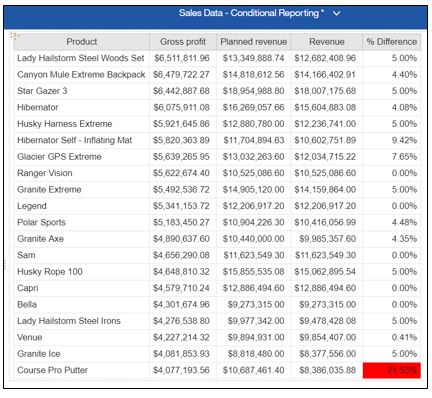
- Get rid of the clutter. Change the report to only show the key information you’re looking for. In this example, we’re interested in seeing the year, product name, gross profit, revenue and planned revenue. We also need a calculation defining the % of difference between planned revenue and revenue.
- Highlight the column body and show the properties box. Press the ellipses button for conditional styling. The Conditional styles box opens. Press the + sign to create the conditional style.
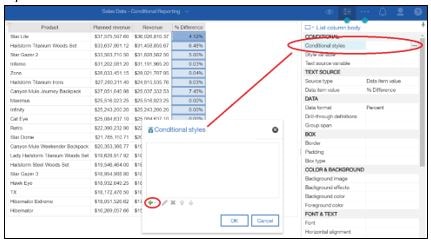
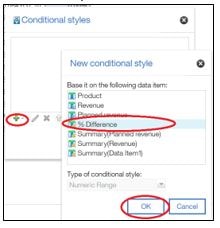
- Choose the option “New Conditional Style” and choose “% Difference” and hit OK.
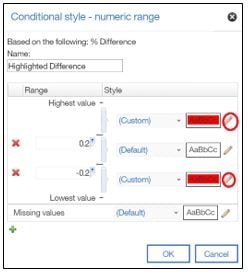
- Name the style “Highlight Difference”. Then press the + sign to create the new value. In our example, we are concerned with anything with a difference over 20% so we created a range between -20% and 20%.
- Now press the edit button in the range we want to identify (i.e. greater than 20%) and choose a background color of red. What we are saying is anything either above 20% or lower than -20% will have a background color of red. Hit OK and hit OK again to save this.
- Now, when we run the report, we are sorting by highest grossing product, but the report also highlights those products where we were off the forecasted revenue by over 20%. This allows us to further investigate. (Note: Keep an eye out for a continuation of this report in our Knowledge Base… We will be using additional techniques to tell a better story and provide an even great user experience)