
Data Modeler or Data Analyst
The act of data modeling can be challenging for a variety of reasons.
Rapidly Evolving Business Needs – it is an uncommon thing today for a business to have a firm grasp on all its needs and if it does, rapid growth (or contraction) of the business can quickly change those needs. A data modeler will need to first understand growth (strategic, internal, organic, and acquisition/merger) and have a “finger on the pulse” of the business to assure the data model design can keep pace and evolve as the business grows.
Complex data and data sources – often a data modeler will need to deal with data coming from numerous sources, each potentially having different structures, sizes, query languages and types. Delivering an appropriate data model design will require competency in each of the data types.
Limitations of Current Data Systems – A data modeler is often asked to create a data model design using current technologies and systems but must be able to be applied to future technologies and systems that may be developed or that the organization is planning to adapt. The successful data modeler must be aware of trends in technology and data to be able to “design with anticipation.”
Budget and Time restrictions – Many, many factors can affect a data model design and budget and time, unfortunately, are two of biggest. Simply put, the idea of creating a “perfect,” innovative data model design is seldom realistic. To be successful as a data modeler you will need to deliver a data model design on time and on budget and one that will meet the most important business requirements of the organization. Not a small task!
Data Modeler or Data Analyst
It is somewhat easy to confuse the roles of a data analyst and data modeler, in fact many “data-oriented” tasks are frequently interlaced and may be performed by either a data analyst or a data modeler. To illustrate this point, a RACI (responsible, accountable, consulted, and informed) matrix can be used to see where responsibility lies for some common data-oriented tasks:
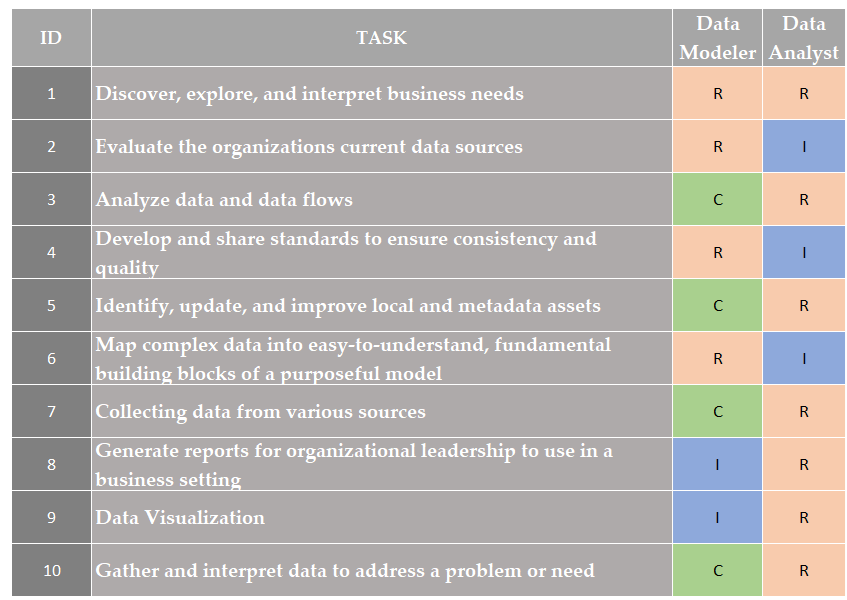
RACI Matrix of Sample Data Tasks
It is important to understand that although some of these tasks may be shared between the two roles, accurate data modeling is vital to any organization’s data strategy and proceeds any (effective) data analysis. The (data) model is the architecture that makes analysis feasible while (data) analysis is about employing data (to find insights and drive better decisions).
Another “take” is that the data modeler is responsible for delivering an “atlas” of sorts containing a grouped and sorted illustration of all the types of data the organization uses along with their source(s), formats, attributes, and relationships. The data analyst then uses the atlas to examine and interpret the organization’s data to extract insights for internal and external business goals.
Leverage the right Tool
Thankfully, there are things you can do to support your data modeling. You have most likely heard the adage, “the right tool for the right job” – well, this is true with data modeling as well. The “right tool” can make modeling easier while using a tool not specifically designed for modeling, limited in functionality, or not well suited for your needs (sources, volume and complexity of your data, level of skills, or simply budget and resources available) can make modeling frustrating and ineffective (and costly as it may take much more time to perform routine tasks).
IBM Planning Analytics Workspace (PAW) has a modeling environment that can be used for data modeling. In addition, PAW is also a comprehensive, collaborative, and centralized analysis environment combining data visualization capabilities with planning and forecasting functionalities, seamlessly integrated data sources, automated data collection, consolidation and more which eliminates complexities and inefficiencies found in more traditional analysis work.
Within the Planning Analytics Workspace environment, user roles are designated as either Modeler or an Analyst (there are also Consumer and Administrator user roles) but as a Modeler, you can use all of the capabilities of an Analyst plus full modeling capabilities (supporting the idea, of course, that data and modeling tasks are shared).
Start with a Workbench
PAW includes a Modeling Workbench which is a dedicated modeling space optimized for all activities required for modeling. You can use the workbench to evaluate and improve data and their sources, including meta data assets, finalize model requirements and create and manage the fundamental building blocks (dimensions, cubes, and links) of a model as well as secure and share assets developed in the form of books and views, visualizations, graphics, and videos.
You can create a new workbench from the Planning Analytics Workspace home page by click > New > Workbench, or from Planning Analytics Workspace home page, Click the Data and Models tile, then click New > Workbench on the Data and Models page.
User preferences play a fundamental role in creating a positive user experience. In more recent versions of PAW, enhanced user preferences allow you to set options in for how the modeling workbench looks and behaves, including the database tree, dimension, process and rules editors, and the cube viewer.
File Manager Feature
The File manager, is a tool that the modeling workbench offers which works similar to Windows File Explorer, and shows a list of all the files and folders that have been uploaded to the Planning Analytics database and allows you to manage (cut, copy, paste, and even compress and expand) files and folders.
Organizing the Workbench
When you open or create an asset, the editor is inserted as a new tab on your workbench. When you have multiple editors (tabs) open, you can move and rearrange the tabs on the “tabset” (you can also maximize individual open editors to provide more working space).
Floating windows can be moved and dragged to any position, including outside of the main application window and can help with multitasking by allowing users to work on another task or process multiple tasks simultaneously. PAW offers the ability to open any editor (cube, dimension, rule, process, or chore) in a separate window that is detached from the modeling workbench. This is helpful when you want to extend the size of the editor. To create a floating window, press the Ctrl key while right-clicking on the desired asset in the data tree. You will see options to open or create in a new window.
Search Feature
Well-implemented search features (ways to easily find what you are looking for) can reduce frustration and increase productivity (even in smaller Planning Analytics models, there could be literally hundreds of assets). You can use the model-level search feature in the modeling workbench to search for any item (cubes, dimensions, views, sets, processes, chores, rules, and control objects) in a database. To search within a model, you can click the workbench Search button, select the model in which you want to search and enter the name of the item to search for.
Conclusion
IBM Planning Analytics Workspace is not only a viable but extremely efficient and exciting to use modeling tool. Above are only a few examples of its numerous (and growing number) of handy features. You can use this link to identify when a new feature is introduced in Planning Analytics Workspace.