
Query Performance Insight proposes to provide “intelligent” query analysis for single and pooled (databases in a pool are on a single server and share a set number of resources ) databases. It identifies those queries that consume the most resources as well as the longer-running queries. This helps find which queries to optimize to improve overall performance as well as to efficiently use the resources available. Query Performance Insight helps you spend less time troubleshooting database performance by providing:
- Deeper insight into your databases resource Database Transaction Unit (DTU) consumption
- Details on top database queries by CPU, duration, and execution count
- The ability to drill down into details of a query, to view the query text as well as the history of resource utilization
- Annotations that show performance recommendations from database advisors
Database Advisors
Azure SQL Database learns and adapts with your application. Azure SQL Database has a number of “database advisors” that provide customized recommendations that enable you to maximize performance. These database advisors continuously assess and analyze the usage history and provide recommendations based on workload patterns that help improve performance.
Let’s Test Drive Query Performance Insight
In order to take a test dive of the Query Perforamnce Insight tool, we’ll create a new SQL Server single database using the Azure portal (you can also create a single database in Azure SQL Database using a PowerShell script or an Azure CLI script). After we have a database up and running, we will use SQL Server Management Studio to manipulate it so that we have some queries in the new database to analyze.
Prerequisites
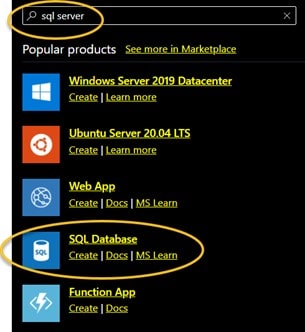
To create a single SQL database in the Azure portal, you’ll need an Azure subscription (or open a free account). Once your logged in, you can navigate to the Azure SQL page or type sql server in the Find space, then select SQL Database:
From there, you can work through the “tabs” (Basics, Networking, Security, Additional Settings, Tags and ultimately, arriving at the Review + Create “tab”) to select and/or enter the options to configure the SQL Server database.
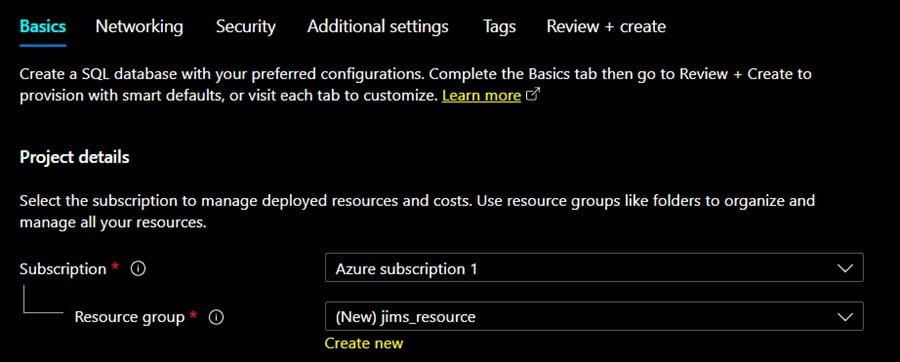
Note: you’ll select or create a Resource group, select a Region, provide a Database name and Server name and then define Compute + storage specifics as well as a Backup storage redundancy plan. Lastly, you’ll need to set Networking and Security options. I selected all minimum options, and white-listed only my laptops IP since this is just a learning exercise (if you forget to set access options, you can always go back and adjust the firewall settings after the server is up and running – using the Azure portal).
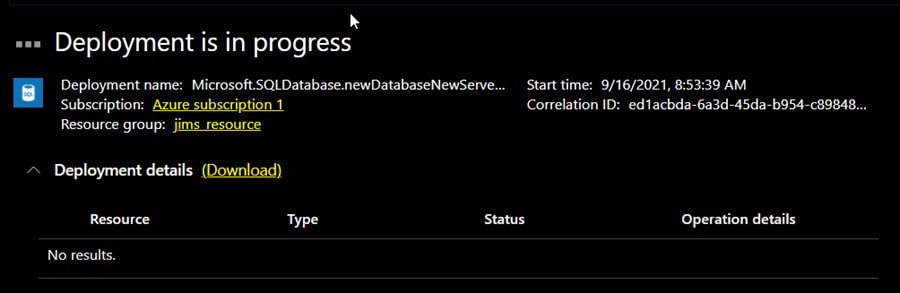
After a quick review, I click Create and wait for Azure to setup my server.
SQL Server Management Studio
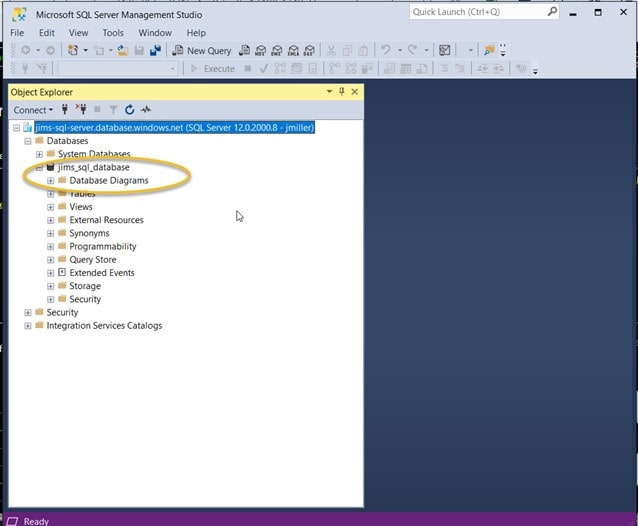
After the server is up and running, I can fire up management studio on my laptop and click File and then Connect Object Explorer.. From there, I fill in the Server name I entered in the Azure Portal, switch Authentication to SQL Server Authentication and then enter the credentials I setup when creating my Azure SQL Server deployment:
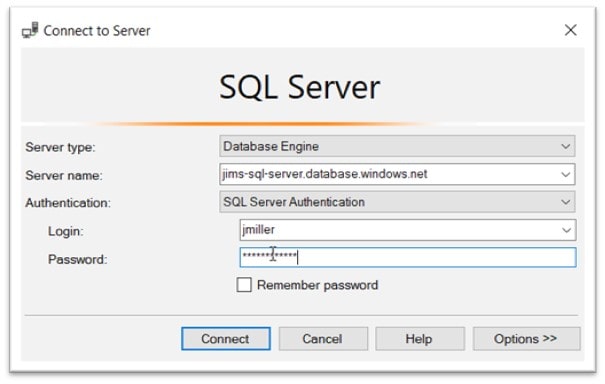
“Poof” I am connected to the sql server database (jims_sql_database) that I just created via the Azure Portal!
Adding Some Test Data
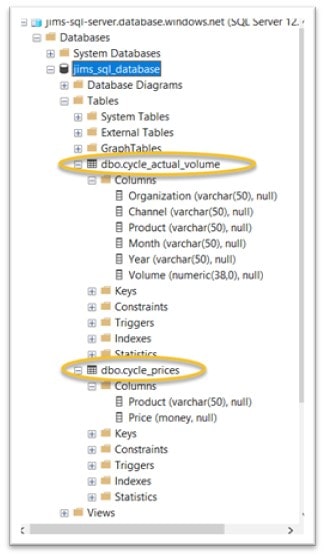
Now we have a working SQL Server running in the Azure cloud which we can connect to but to do any query analysis (using Azure Query Performance Insight) we’ll need to add some tables with data. I don’t want to spend too much time here building tables and loading data since my goal is to experiment with Query Performance Insight, so I just used the SSMS Import and Export wizard to create some simple tables and load data to them from some flat files. I added 2 tables: “cycle_actual_volume” (which is sort of a sales table holding the number of motorcycles sold by month and year) and “cycle_prices” (kind of a price list fact table which holds the base price for each motorcycle):
Azure portal’s Query Editor (preview)
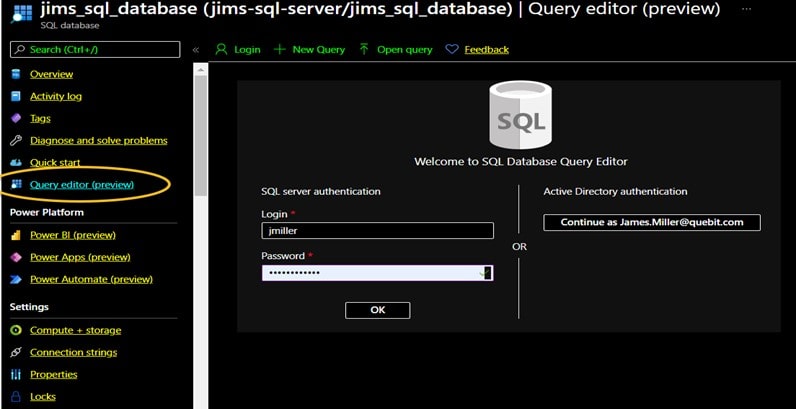
The Azure Query Editor is a tool in the Azure portal for running SQL queries against an Azure SQL Database or data warehouse in Azure Synapse Analytics. Let’s try using it on our new tables. From the Database menu in the portal, click on Query editor (preview) and log into our database:
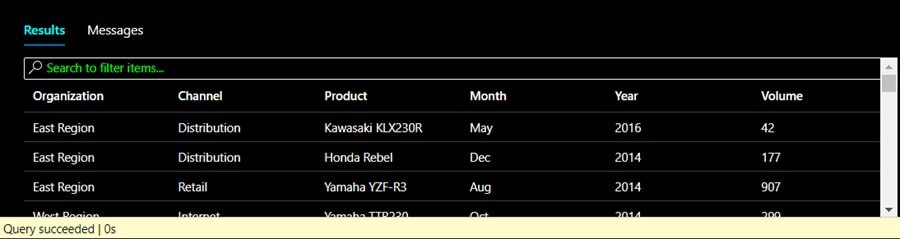
Once authenticated, we can see our newly created tables in the left pane of the editor and type out a simple SQL command within the editor:
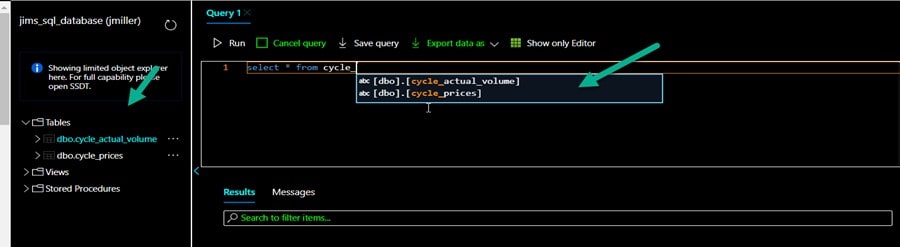
From there you can click Run and then see the results:
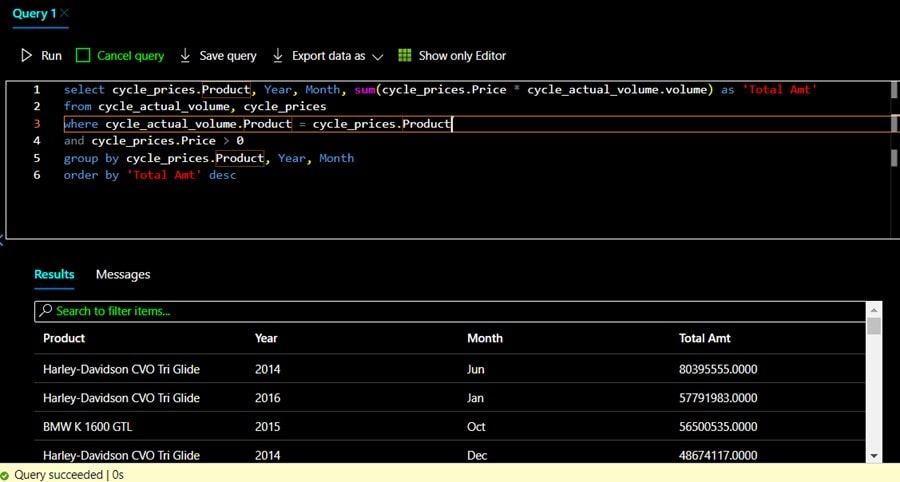
Looks good! (well we see our data anyway ). Let’s try running another query on our tables before we move on to trying Query Performance Insight. In this query I’ll try joining the 2 tables as well as calculating a new value (“Total Amt”):
Now, we should have generated at least some activity to inspect with Query Performance Insight.
Back to Query Performance Insight
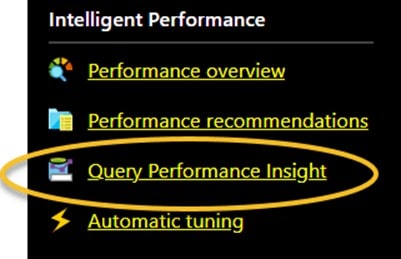
To access Query Performance Insight you (from the left-side menu) find Intelligent Performance then click on Query Performance Insight:
Notice that there are three tabs shown: Resource consuming queries, Long running queries and Custom. On the first tab you can review the list of top resource-consuming queries. The queries can be visualized by CPU, Data IO and Log IO. You can use sliders or the zoom icons to change the observed interval
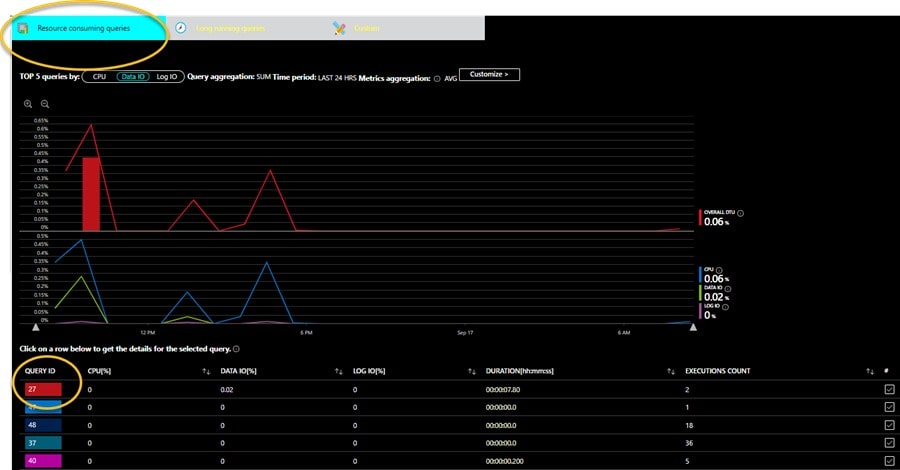
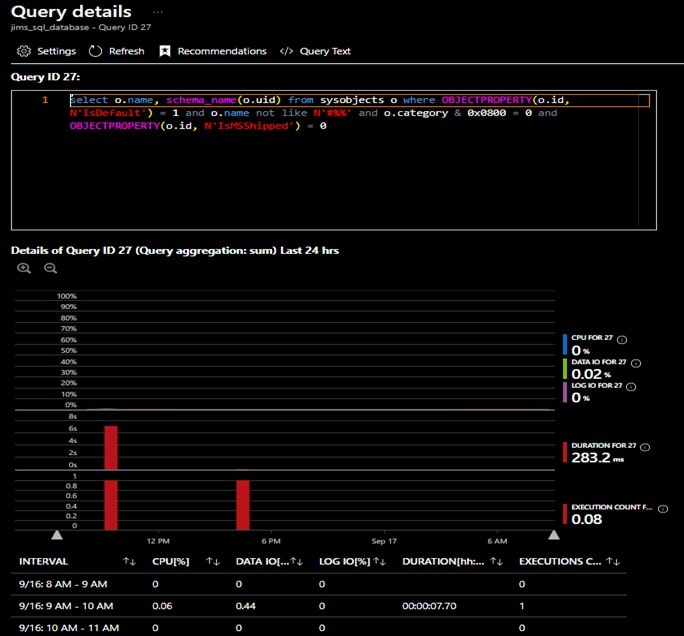
You can also click on an individual QUERY ID to view its details:
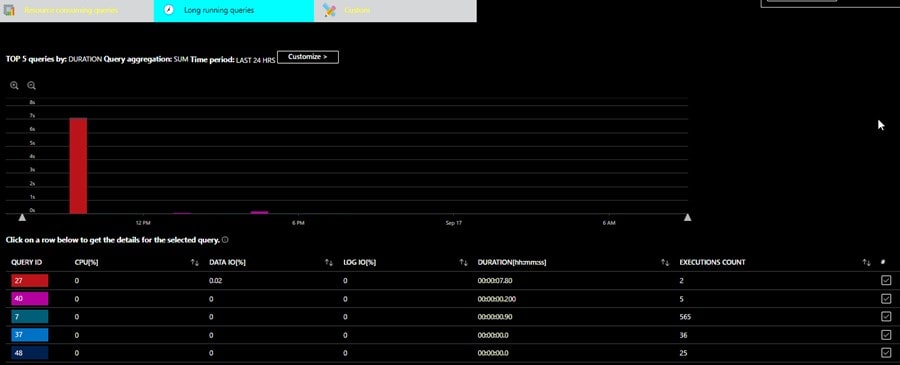
You have the same access to Long running queries:
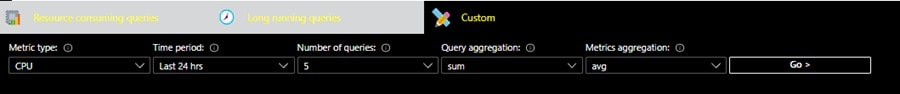
Lastly, under Custom you can use drop-down list selections to adjust the Metric Type, Time period, Number of queries, a Query aggregation as well as a Metrics aggregation:
The Query Store feature in Azure Database for MySQL is the “source” behind Query Performance Insight in that it provides a way to track query performance over time. The Query Store automatically captures a history of queries and runtime statistics, and it retains them for review. It separates data by windows of time so that you can see database usage patterns.
A disclaimer: for Azure SQL Database to render the information in Query Performance Insight, Query Store needs to be enabled and needs to capture at least a couple hours of data. Query Store is not enabled by default for new SQL Server and Azure Synapse Analytics databases and is enabled by default for new Azure SQL Database databases. You can enable and manage Query Store by using Use Transact-SQL Statements or by way of the Query Store Page in SQL Server Management Studio.
Additionally, if the database has no activity or if Query Store was not enabled during a certain period, the charts will be empty when Query Performance Insight displays that time range.
Conclusion
The queries I used in this exercise were trivial and as a result the query history and runtime statistics we saw in Query Performance Insight wasn’t very useful however it was enough to perhaps demonstrate the potential that lies with the tool. I look forward to leveraging Azure Query Performance Insight in a production environment very soon.