Do you need to create a new or modify an existing Adaptive OfficeConnect report and don’t know where to start?
Well, look no further. We are here to help you get started with Adaptive OfficeConnect Reporting!
Adaptive OfficeConnect integrates your Adaptive Insights data directly with Excel, Word, and PowerPoint. It is a breeze to create and update management reports with real-time actuals, plans, and forecast. You have the power to click, drag, and drop dimensions, accounts, and time periods from the Reporting Pane to build consistently formatted P&Ls, Balance Sheets, Cash Flow statements, board packs, and presentations.
Intuitively designed report building
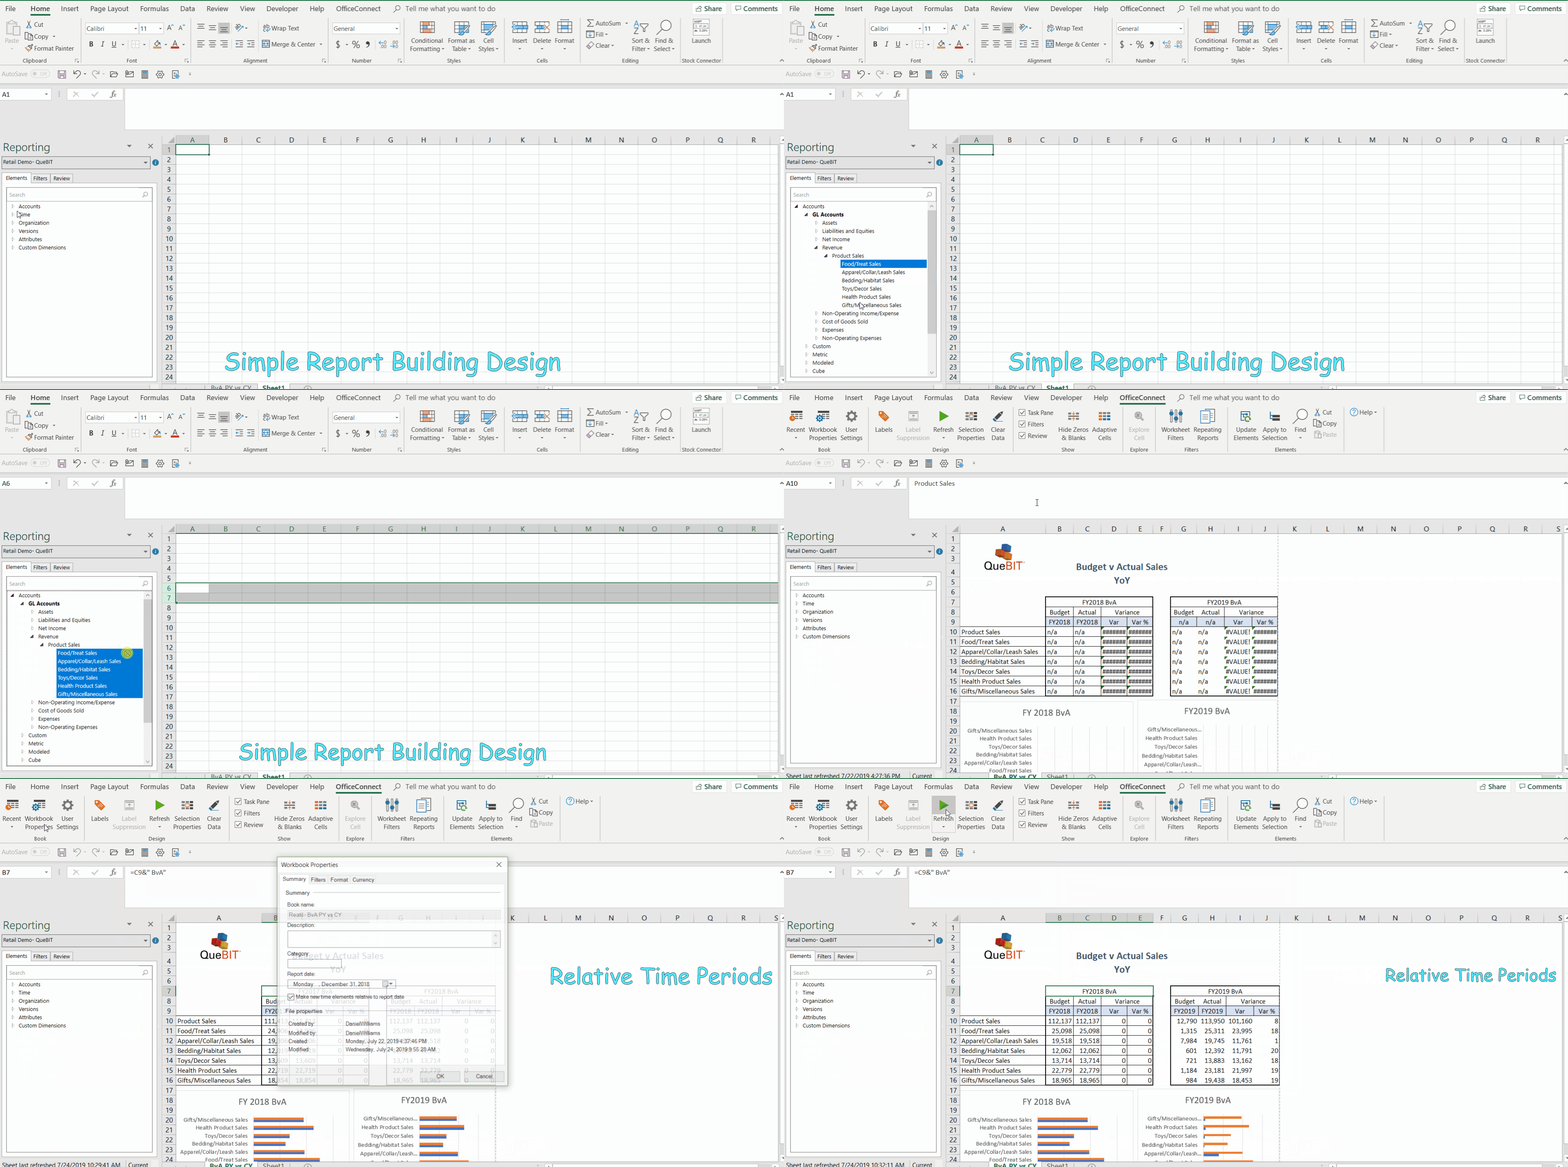
Within the Reporting pane, users can access structural elements to build the foundation of dynamic OfficeConnect reports all without formulas, backlinks, or code. Simply navigate within the Reporting Pane, drag the element to the report and drop the element to the row, column, or cell. To overview the architecture of the report, highlight a row, column or cell, then in the Reporting pane, click the Review tab.
As shown within the illustration below, we selected each of the structural elements within Product Sales and easily dragged and dropped our multiple selections within the highlighted rows at right. This feature works great when working with an existing report as well. This concept of drag and drop can be applied to all elements displayed within the Reporting pane for rows, columns, and individual cells.
If you would like more information on how to build Adaptive OfficeConnect Reports from Existing Excel files, please refer to the Adaptive Insights Knowledge Base article here.
Single-Click Refresh
No need to phone IT to refresh your reports. You can alter the time period in a report, and update every sheet automatically with just a single click. Smart labels automatically update time periods, page headers, and more.
Save Time with Relative Time Periods
Working in tandem with the refresh feature, Relative Time elements allow reports to dynamically update sheets based on the current report date. This means after initial creation, no manual manipulation is required to refer to the quarter-over-quarter period. What a time savings!
As detailed within the illustration below, we accessed the Workbook Setting within the OfficeConnect ribbon to show the functionality of relative time periods within Adaptive OfficeConnect. With a simple reporting date change, we instantly see all of our report updates upon refresh to reflect today’s numbers.
Sharing and Uploading to Adaptive Insights
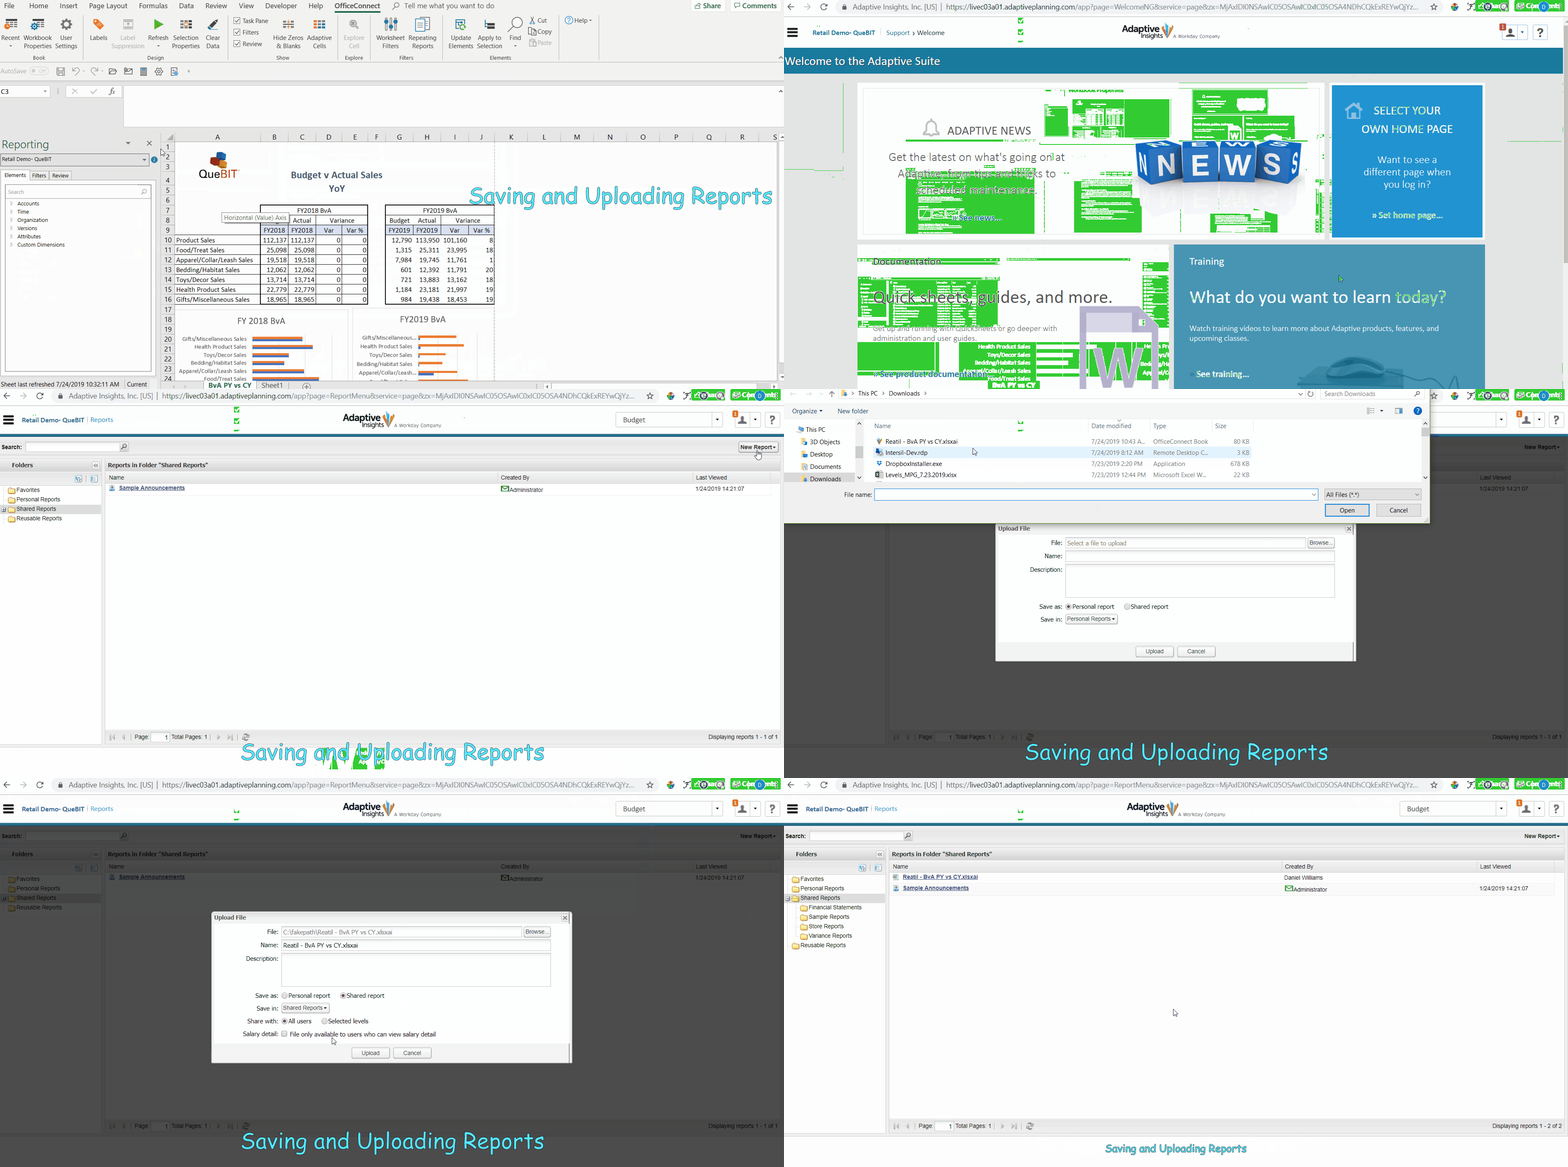
Sharing reports and uploading reports to Adaptive Insights has never been easier. After creating your Adaptive OfficeConnect report, save your report and navigate to Adaptive Insights to the Reports menu.
Within the Reports menu, you can upload reports to Personal or Shared areas for future use. Maintaining a library of reports and distributing level-based access to those reports increase time savings across the entire planning cycle.


“Click here to check out QueBIT’s ReportWORQ for AI which makes the job of generating and distributing dynamic reports from Adaptive OfficeConnect EASY!”
