
You can add rules (or “formulas”) to a cube in IBM Planning Analytics to create complex data calculations based upon your organizations business rules. Rules can do a variety of things, such as override consolidations that are occurring in the cube, calculate values (like sales = units multiplied by item price), and so on. But Planning Analytics Workspace also provides users the ability to enhance views with various calculations within the interface without having to create a new rule.
Summary Calculations
Summary Calculations apply to all leaf members and all unexpanded consolidated members that are visible on a row or column within a view and the calculation updates automatically when the members visible in the view change (either by drilling down or rolling up a consolidated member, or by changing the set used in the view). There are a number of “out of the box” summary calculations that you can easily implement. These are:
- Average which displays the average value of the members.
- Minimum and Maximum that displays the smallest and largest value of the members.
- Median is handy to displays the median (or middle value) value of the members.
- Sum simply displays the total of the members.
- Aggregate creates an aggregate calculation allowing you to summarize values that can’t easily be added up or averaged.
Examples
To create a summary calculation, you simply right-click on a row or column label in a view (that you want to create the calculation on) and then click Summarize all. On the Summarize all dialog, you can optionally type a name for the calculation (you can also use the Rename feature later to change its name), select the type of calculation that you want to create, and then click OK.
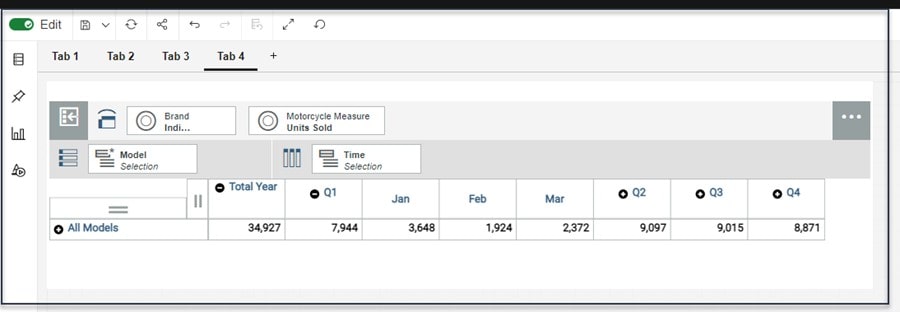
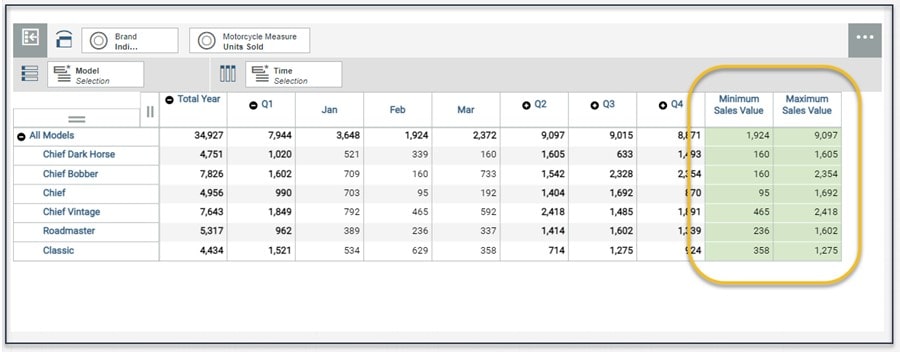
Let’s try adding a Summary calculation to a view. Suppose we have a view showing a Time dimension on columns. It shows Total Year, which is expanded to show Q1, Q2, Q3 and Q4, and Q1 is expanded to sow Jan, Feb and Mar. Below we see motorcycle sales for all models of a selected brand by each time period mentioned:
If we want to create a summary calculation on all of the visible columns to show us the minimum values of each row, how would we do that, and which members will be included in the calculation? Well, first we can select all of the columns, right-click on any selected column label and select Summarize all…
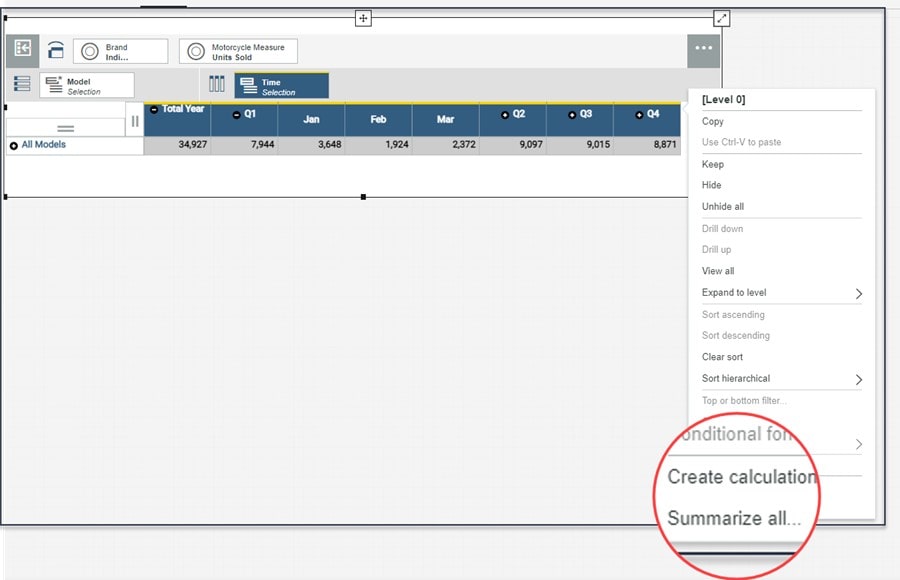
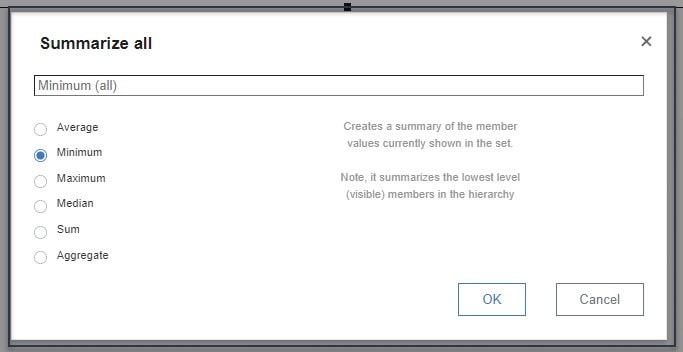
On the Summarize all dialog I’ve let the name default and selected Minimum:
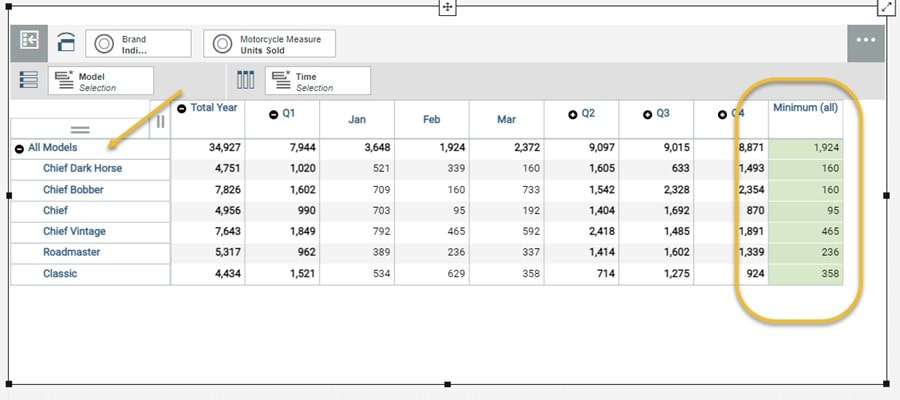
Once I click OK, PAW adds the new column to the view, and I can see that it has automatically calculated the minimum value of each row. If I drill down on the “All Models” calculation (to show sales by each model) the summary calculation again automatically calculates the minimum value for each model row:
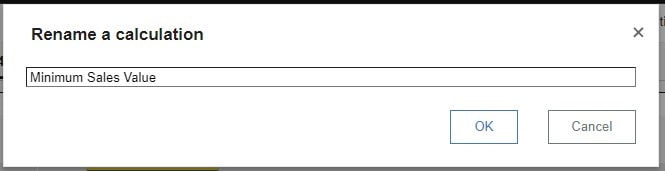
Renaming a Calculation
Since I let PAW name my calculation, I can now right click on the row label of the calculation and on the Rename a calculation popup, I can enter a “better” name (and don’t worry, PAW will spell check whatever you type for you!):
Below you can see the updated calculation name – I’ve also added a Maximum Sales Value calculation as well:
Once you save the view, your summary calculations will be saved with it and will also be visible to any user that has access to the view (and underlining data).
Interested in Planning Analytics Workspace?
Are you interested in enhancing your IBM Planning Analytics Workspace views using summary calculations and other features? Contact QueBIT today. We would be happy to discuss your needs and offer recommendations.