
You can explore IBM Planning Analytics data using Exploration Views. Using Exploration Views, you can not only quickly change how you see data – you can also manipulate the data to better understand relationships within the data. Here are just a few techniques you can use to manipulate an Exploration view in Planning Analytics Workspace (PAW):
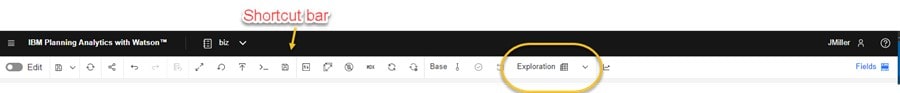
To start, make sure that you are using an Exploration view by clicking on the visualization then (on the shortcut bar) picking Exploration:
Summarize All
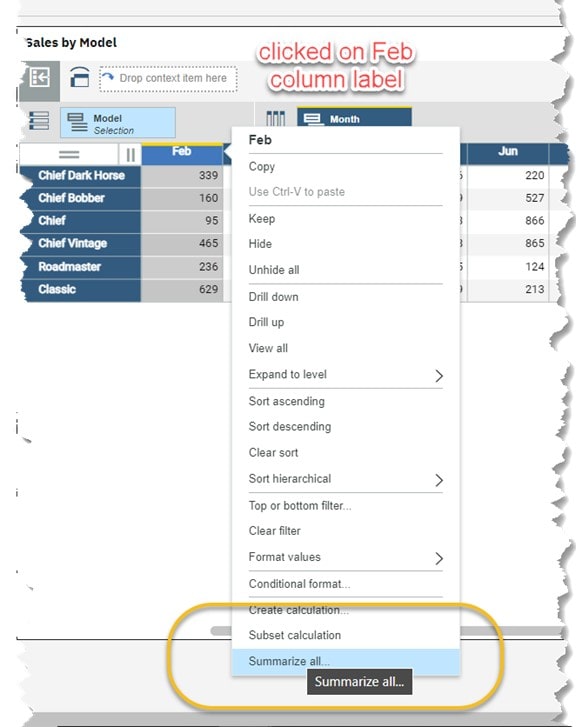
A summary calculation applies to all leaf members as well as all unexpanded consolidated members that are visible on a row or column and updates automatically as you change the members visible in the view. To create a summary calculation, you can:
Right-click a row or column label and then click Calculations, then Summarize All:
On the Summarize ALL dialog you select the type of calculation you want to create and can enter a name for the calculation (this is the name that will appear as a row or column label in the view).
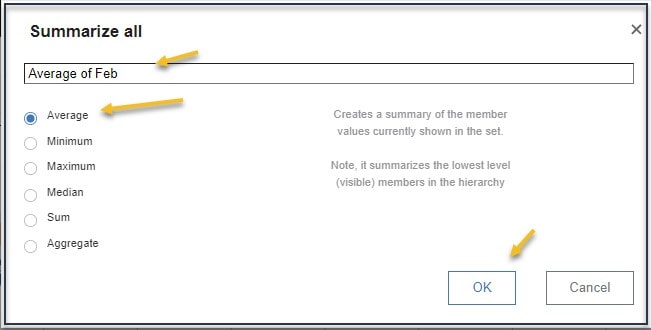
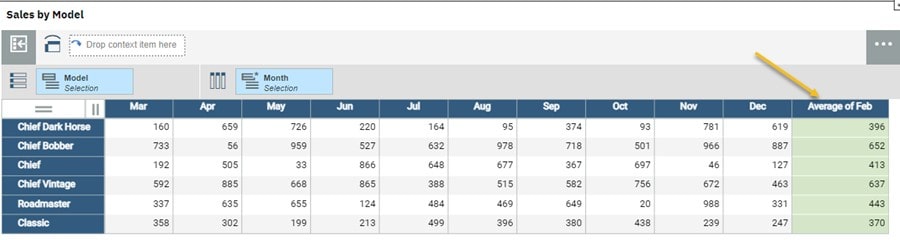
Click OK and your Exploration will be updated to include the Summary Calculation:
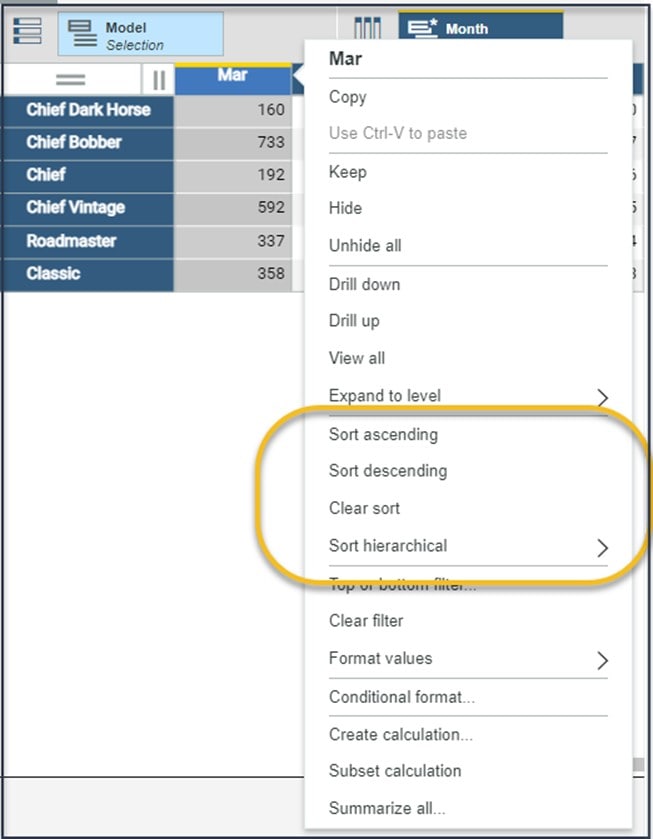
Sort Hierarchical
You can sort labels or values in ascending or descending order and can choose to sort by hierarchy, or to sort breaking the hierarchy. To sort by label, right-click either the row selector , or the column selector , and select the sort option you want. To sort by value, right-click in the row or column and select the sort option you want. To sort values within a hierarchy, right-click on the hierarchy label, select Sort hierarchical, then choose your option:
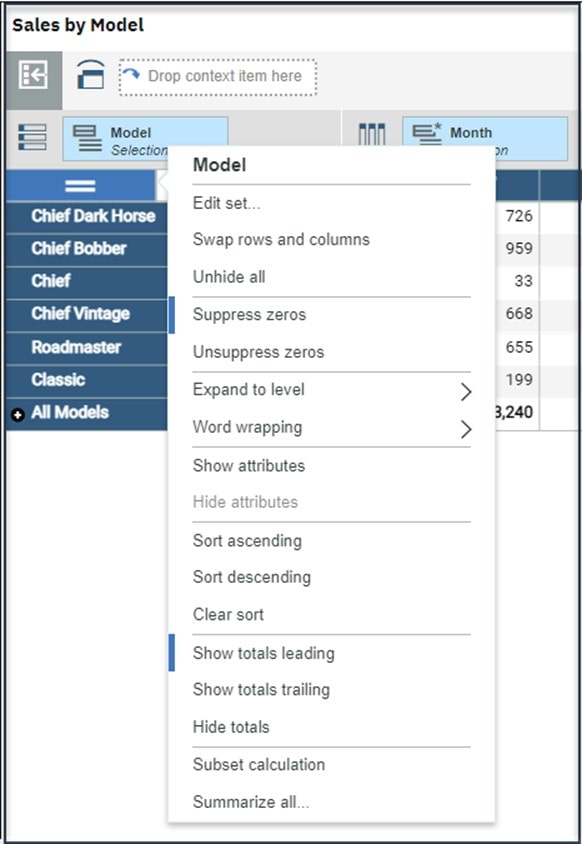
Show Totals as Trailing
You can also show and hide totals in a view as well as choose whether totals are leading or trailing. To affect a total, you can right-click on either the row selector, or the column selector, and select one of the Show totals options. When you edit a set, you can click the Show Leading/Show Trailing icon on the Set Editor to toggle the position of totals:
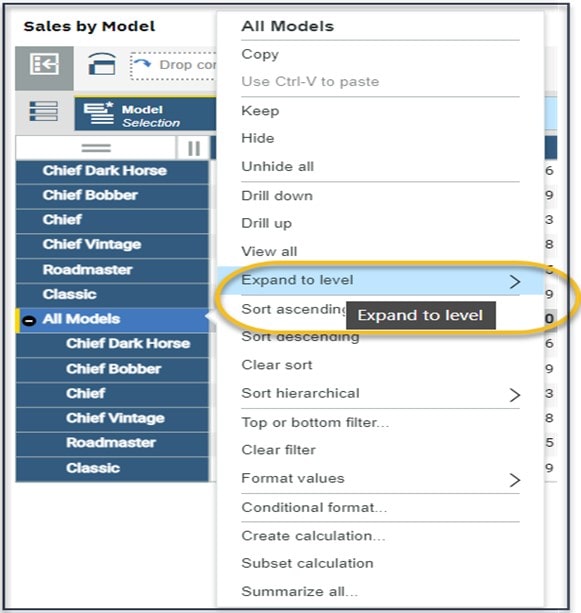
Expand to Level
You can expand levels in a dimensional hierarchy to a specific depth. To select a specific level to expand from the menu you right-click a consolidated member that you want to expand then click Expand to level, then select the level you desire:
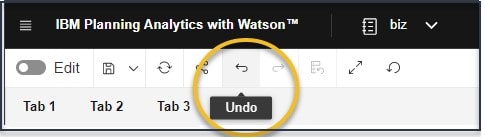
Undo
Keep in mind that the Undo feature is always available on the shortcut bar. If you are experimenting with the above manipulations and don’t like the result just click undo and start over.
Final Thoughts
Are you interested in improving your skills with IBM Planning Analytics Workspace? Contact QueBIT today. We would be happy to discuss your needs and offer recommendations.