
What is Certent CDM? It is a reporting management platform where you can create, compare, and communicate all crucial aspects of internal and external reporting with flexible deployment, on-premises, or in the cloud to best support your global business needs. If you are using CDM and need to report on TM1/Planning Analytics data, don’t worry – you can take the following approach.
Know your cubes. Start out by identifying in which cube the data that you want to report on resides. Once you know which cube it is (assuming you have access to it), the easiest approach will be to create a view on that cube that is designed specifically to display and format the data that you want to report on (you can create a TM1/PA view from within CDM, but it is recommended that you create it within TM1/PA). A VIEW is an “optimized layout” of a cube specified by the cube arguments, a view is a perfect “source” for a CDM report.
How do you create a view in TM1?
There are many ways to create a view in TM1/Planning Analytics. For this exercise, to get a bit more familiar with Planning Analytics Workspace (PAW), let’s use the modeling workbench feature to create a new cube view:
- Log in to PAW and click on the Home
- Select New, and then under Modeling, click on Workbench. Now you have a new “workbench” to build and edit on.
- On the left pane, you should see the databases that are running and available. Find your database and click on it to expand it. If you have access to the database, it should now show Cubs, Dimensions, Processes, Chores and Control Objects.
- Expand Cubes, and then locate the cube that you want to build your new view on.
- Expand the desired cube and then, to the right of Views, click on the “3-dot” icon and select Add new view. A new view will be added on the left space of the page.
- In the view, manipulate each of the dimensions to include the elements and/or aggregations that you’ll want to “pull into” CDM.
- Click the Save icon and select Save to server.
- Enter a name for the new view and make sure that “Save as private view” is NOT
- You’re done creating your new view!
Loading Data
You may already have the data in your cube that you want to report on (using CDM). If you do not, or you need to refresh data, one way to quickly and easily load external data to a cube is by again using Planning Analytics Workspace and the “Import Data” feature. If you have a general understanding of how your data “matches” the dimensionality of the cube, you’ll find it very easy to “drag and drop” (data) from a file into its place in a cube. I think it’s worthwhile going over how this works so, assuming you have already logged into PAW and still have your workbench open, you can:
- On the cube that you want to load data into, right click and select “Import data”.
- The “Import data file” dialog should “popup” which you can then use to identify the data file that you want to load.
- Once you have identified the file, the dialog will “act like a wizard” and step you through providing the basic information PAW needs to read and load data from your file into your cube. This information includes:
- The number of header rows in your data file
- The delimiter character that separates the fields of data within your file (typically a comma).
- The “mapping” of each field in the file to the dimensions and measures in the cube.
- If want to clear data in the cube before loading the data (or not).
- To overwrite OR accumulate numeric data.
- If there are decimal and/or thousand separators in the numeric data in your file.
- If you want to save the wizard selections as a reusable process (or not).
- Once you have provided the basic information listed above you can click Continue and PAW will load the data (and give you a record loaded count upon completion).
CDM Setup
CDM needs to have a “data connection” (a dynamic link between your CDM report and a data source that stores or provides data for that report) configured so that it can “talk to” TM1/Planning Analytics and access data stored there. If one is not already set up for you, log into CDM using an administrator ID or a user ID that has appropriate access levels. Next:
- Under External Data, double-click on the “Data Source Connectivity”.
- Add an OLAP Data source (you’ll need credentials specific to your environment):
- Admin host, using this format: http://00.000.0.00:5498
- NAT Server IP: match the IP above IP (this is the Network Address Translated IP)
- Th TM1/PA User ID and Password.
- The TM1/PA Server name.
- The cube name.
- Be sure to click on the “Test Connection” button to ensure the connection is established correctly.
Building a CDM Query
Once a CDM data connection has been configured, you need to create a CDM “report query” to bring the desired data into CDM from the Datasource. To do that, I suggest using a cube view (similar to the one we set up earlier) since a view can more easily be made dynamic within TM1/PA. To create a CDM query, you can:
- Double-click on “Data Queries” under Administration and External Data.
- On the Home ribbon, click on Add – OLAP Query.
- Name your new query and select the OLAP Data Source we configured above.
- Select the previously created view.
- After you have set the view for the Query, click “Next” and validate that data renders.
- Click “Next” and select which reports to associate with this query. Notice that you can select as many reports as you would like. Note: best practice recommends that you do not set “Make this Query Global” as this will allow ALL users and groups access to the data, potentially posing a potential security concern as more reports get built and more users gain access.
Adding the Data to a CDM Report
Now that we have created and saved a CDM Data Query, we can utilize it to pull data into a report in CDM. Assuming that you have already created a report in CDM and have associated a data query with it (step 6 in the above section), you can locate and open the report (File, then Open) and then:
- Right-click on the report and select Add Child then Excel Object.
- Rename the newly added Excel document to something more explicit (perhaps “My Variables”):
- Open the Excel document (in this example “My Variables”). There should be 2 worksheets (“Sheet1” and “Database”):
![]()
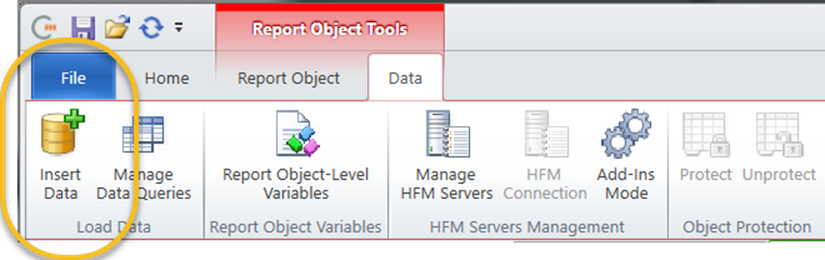
- Click on the Database tab and then select a cell in the worksheet. Click on Insert Data (from the Data ribbon):
Note that if the Insert Data icon is greyed out then 1 or more of your report objects have not been “checked out” by you and you’ll need to check them out before you can insert data (or make any changes). If an object has been checked out by you in another session or by another user, you can go to Administration, select Security and then Undo Checkout.
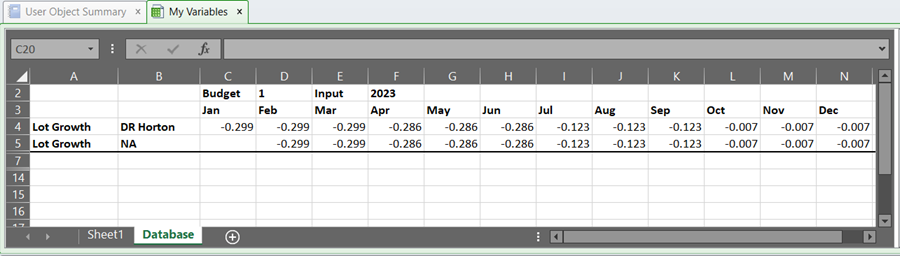
- Find and select the data query (then click Next and Finish). The results of the data query should now be shown in the Database worksheet of the Excel object:
- Select the Sheet1 worksheet in the Excel object, then select Insert Variable (from the Report Object ribbon):
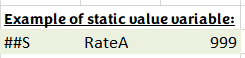
- Sheet1 is where you can now define variables to be used within the actual CDM report. For example, you can use the key: ##S to signify a “source variable”. Below is an example of a static variable showing the variable “key” (##S), the variable name (“RateA”) and the variables “static value” (999):
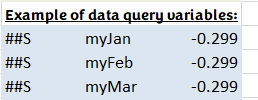
- Next, I show some variables that use field results from the data query. Note the key (##S), their names (myJan, myFeb and myMar) and finally the resultant values from the data query we set up on the Database tab:
- Save Sheet1.
- Open the Word document (the CDM report, in this example it is “My Initial Rates”) and make sure that it is checked out.
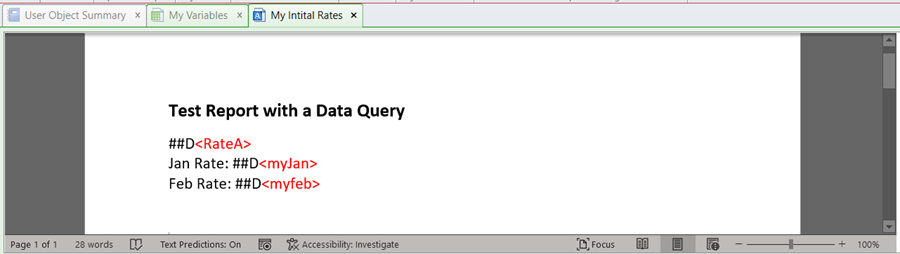
- Insert a destination key (##D) and the variable name (enclosed in <>) for some of the variables we defined. The report may look something like this:
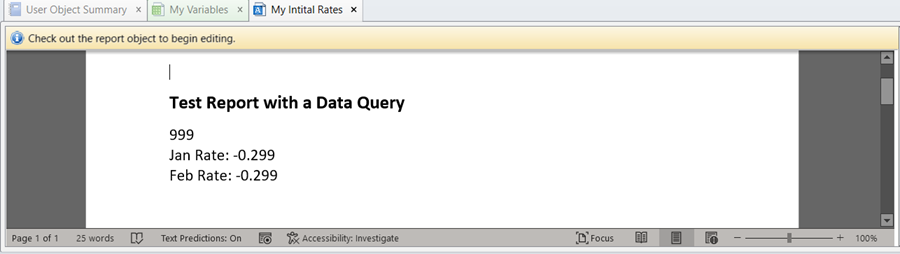
- When you save the report and check it back in, the variables should resolve and show the actual values:
Using an Image
Another neat feature of CDM is the Image Range. This is where you can define (as a variable) a range of cells and tell CDM to “treat it as one” (sort of like merged cells in Excel). To do this you use “Image Range” keys (#IRS and ##IRE) to define an image variable. In the below example the image range is defined as cells D20 through D24, where I have colored the cells and added some text:
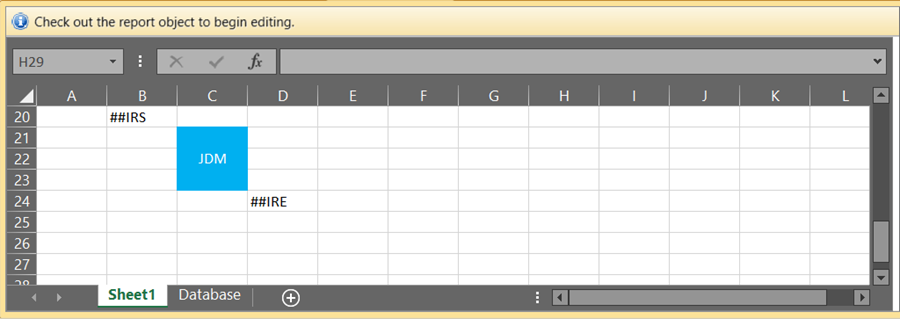
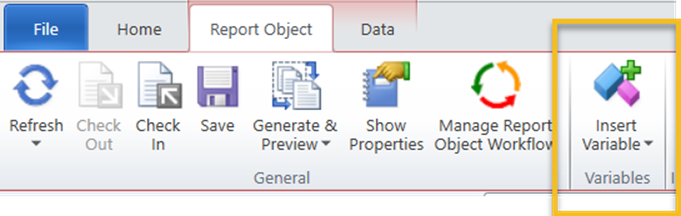
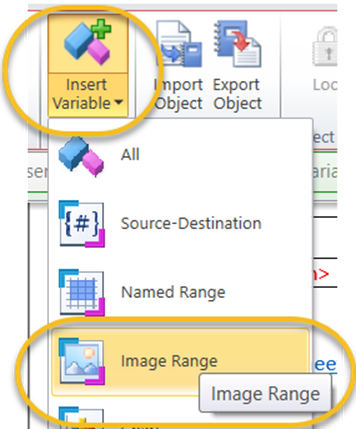
The difference between the source key we used earlier, is that since image ranges use multiple cells, it requires 2 keys – one to start the range and one to end th range. ##IRS stands for “image range start” and ##IRE stands for “image range end”. To add this (image) variable to the report you need to click on Insert Variable (on the Report Object Tab) and then select Insert Range:
CDM will “convert” the range of cells defined (by the image range keys) to an “image” and place a reference to it (the range of cells) in the report. The reference will look like this:

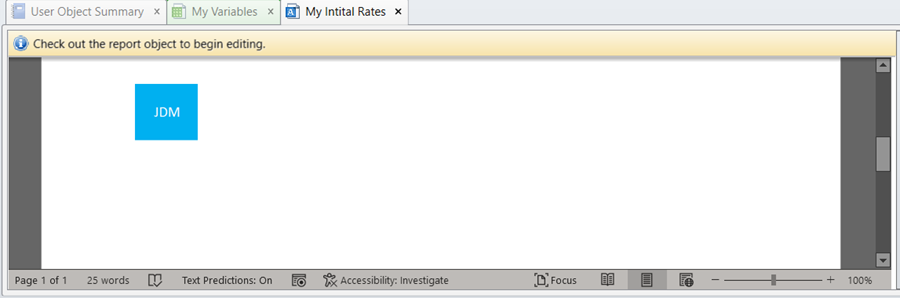
One you save the report and check it back in, the “image variable” will resolve to look like this:
Wrapping Up
There certainly is a lot more “too” CDM but hopefully this article points out the basics of integrating TM1/Planning Analytics data with CDM to automatically produce and update reports. Not sure? Want more? Give QueBIT a call and let us discuss the options for integrating TM1/Planning Analytics (or other sources) with CDM (or other applications).