
You’re kidding, I can now drill through to a report from a dashboard!
One of the most popular Cognos Analytics (CA) enhancement requests across all of IBM has been the ability to drill from a Dashboard to a Report. Well, it can now be done. It is an easy task to author a drill-through that passes the context of a dashboard visualization to an authored report. Here’s an example.
Business Case:
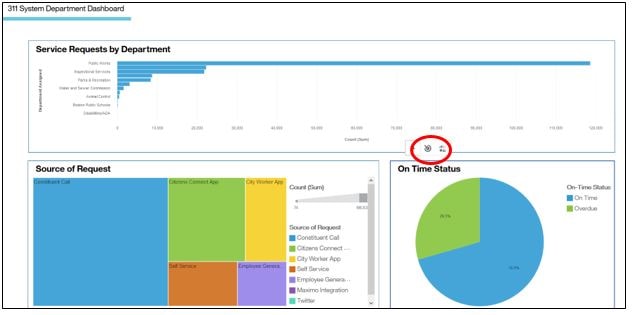
The City of Boston currently utilizes a “311 System”, which enables city residents or city workers to easily report non-emergency issues. In an earlier article, “Interactive Dashboards in Cognos Analytics 11.0.0+”, we created a dashboard for the department coordinator. It is an interactive dashboard which enables a user to monitor service requests for the city; as well as the requests by individual department, the source of the request and on time status.
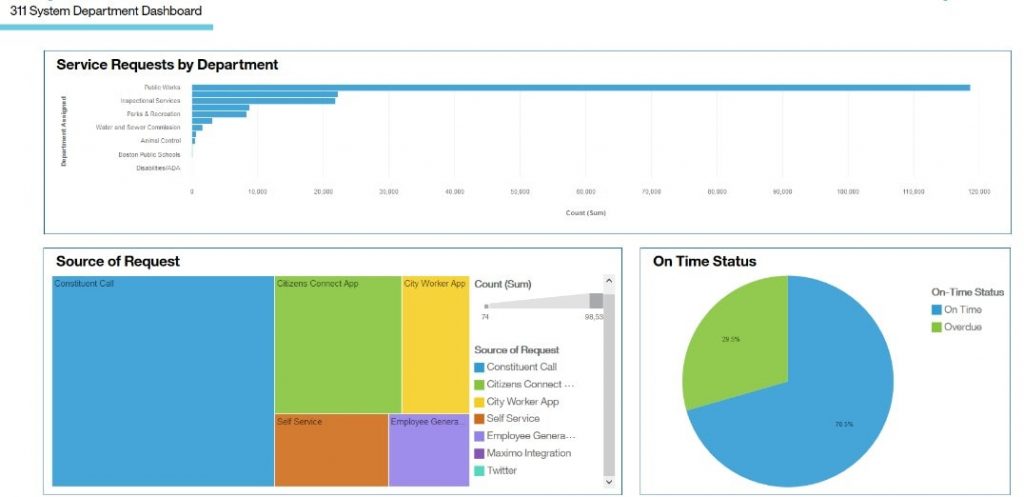
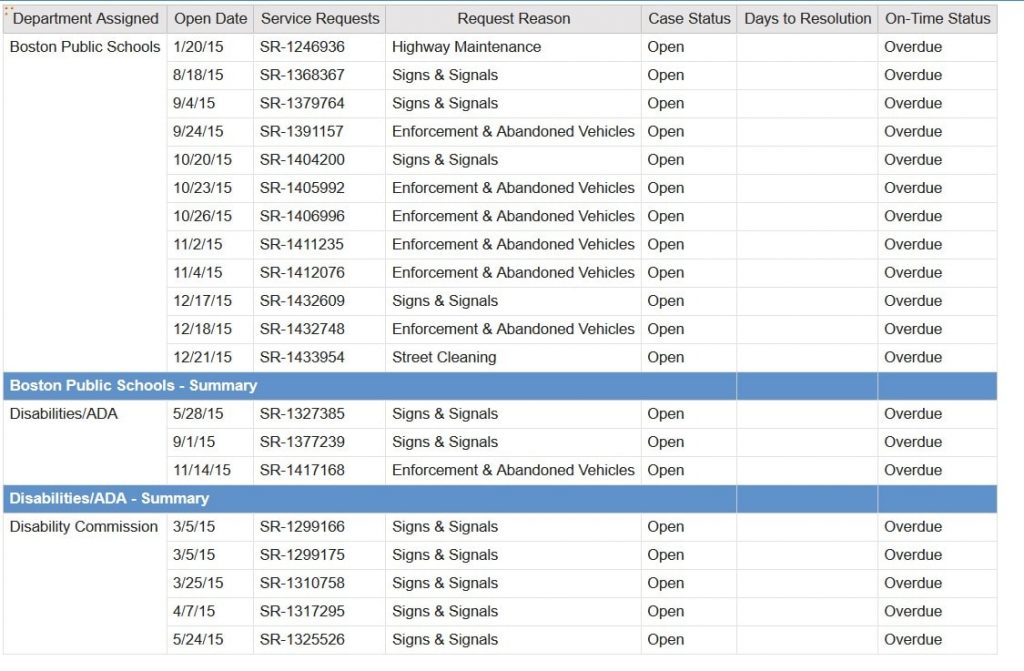
In this article, we want to enhance the dashboard by adding the ability to drill through to a detail report behind the On-Time Status visualization, specifically listing the calls which are open and show a status of “Overdue”.
Procedure:
- Open the Dashboard created in the last Knowledge Base article, “Interactive Dashboards in Cognos Analytics 11.0.0+”.
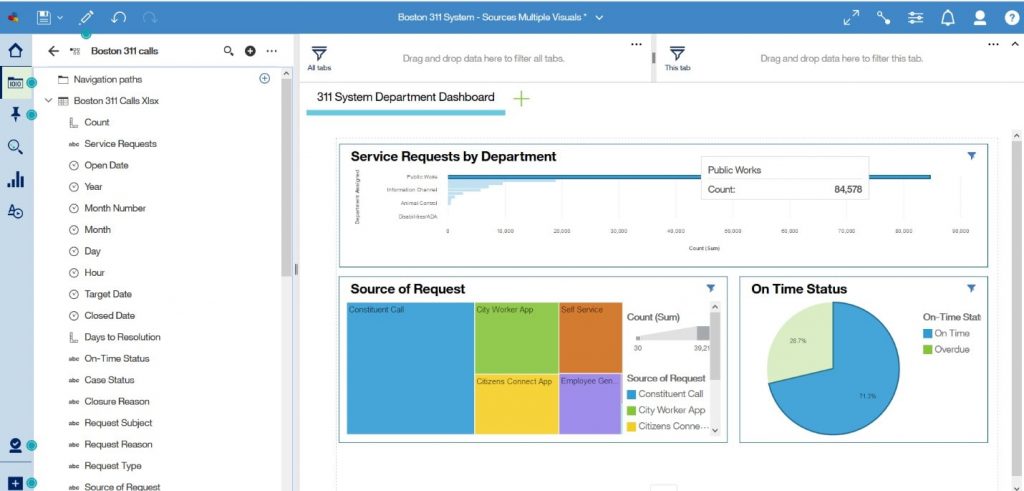
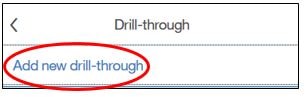
- Single click on the “On Time Status” visualization to access the tool bar. Click the “Drill-Through” icon
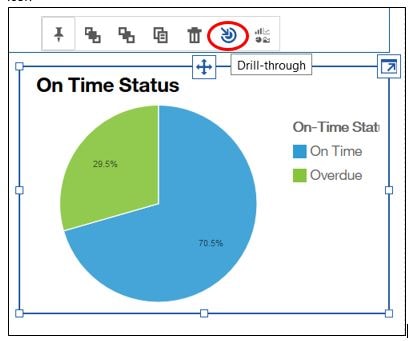
The option to add a drill through appears.
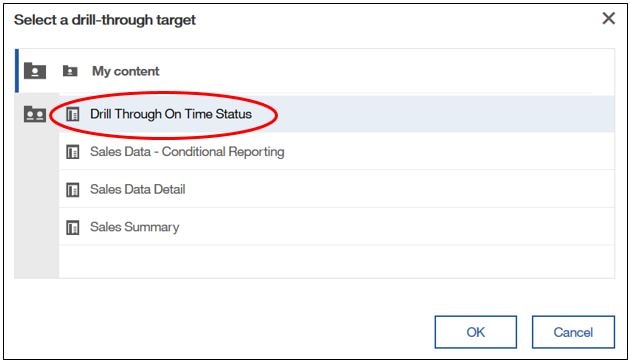
- Select the target report. In this example, I have already created a simple report and saved it as “Drill Through on Time Status”.
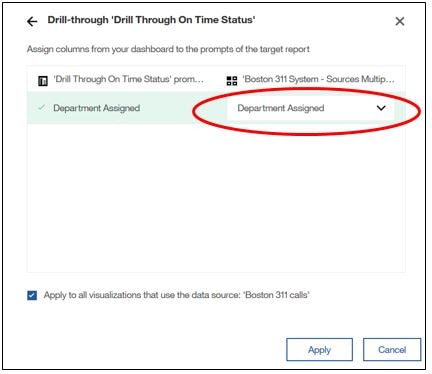
Note: Just as in a report-to-report drill through, you must ensure you have created optional prompts which correspond to the columns in the visualization which will have their values passed. If done correctly, you will be asked to assign the columns from your dashboard to the prompts in the target report as shown below.
The final step is to apply and save the dashboard.
- To access the report via the dashboard, execute the dashboard. Click on the visualization you originally added the drill through on and click on the drill through icon.
Note: The default name of a drill-through can be changed and, as a convenience, a single drill-through created for a single visualization can be applied to all visualizations based on the same data source in a dashboard.