
How do I create dashboards and custom reports in Netsuite?
Introduction
NetSuite continues to evolve as a powerful analytics platform, offering flexible, role-based dashboards and advanced reporting tools that adapt to modern business needs. Whether you’re tracking real-time KPIs, analyzing financial performance, or monitoring operational trends, NetSuite’s SuiteAnalytics capabilities enable you to build highly customizable, data-driven insights across your organization.
In this guide, we’ll walk through how to configure dashboards and reports in NetSuite using current best practices, leveraging tools like SuiteAnalytics Workbook, saved searches, and role-based personalization. You’ll learn how to design meaningful visualizations, tailor reporting for different teams, and turn your NetSuite data into actionable insights that support faster, smarter decision-making.
Creating a Dashboard
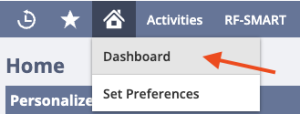
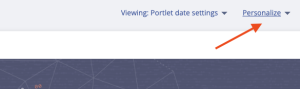
Navigate to Home > Dashboard > Personalize.
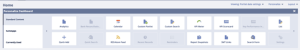
Add Portlets
- Select the type of portlet you want to add (e.g., KPI, Chart, List, Report).
- Configure the portlet settings such as data source, filters, and display options.
Arrange Portlets:
- Drag and drop portlets to arrange them on your dashboard.
Save and Share:
- Share your dashboard with other users or roles by Publishing it. When you publish a dashboard, you can define the roles of the users who can see it and what changes they can make
Creating Custom Reports
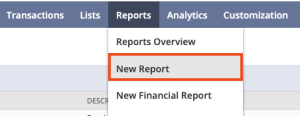
Navigate to the Report Builder:
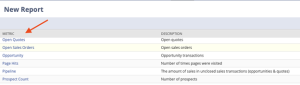
- Go to Reports > New Report
- Select the Metric for your report (e.g., Sales Orders, Customers).
Configure Report Settings:
- Select the fields you want to include in your report.
- Apply filters to narrow down the data (e.g., date range, status).
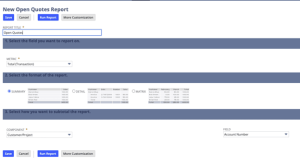
Save and Run Report:
- Click on “Save As” to save your report with a unique name.
- Run the report to view the data based on your configuration.
Adding Reports to Dashboards
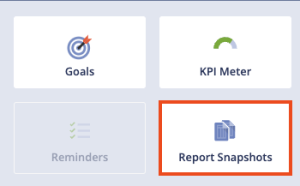
- Navigate to your dashboard and click on Report Snapshot.
- Choose the saved report you want to add to your dashboard.
- Configure the report settings such as display options and filters.
Tips for Effective Dashboards and Reports
- Focus on Key Metrics: Include only the most relevant and important data on your dashboard.
- Use Visualizations: Use charts and graphs to make data easier to understand at a glance.
- Regularly Review and Update: Update your dashboards and reports as your business needs change.
- Share Insights: Use dashboards and reports to share insights and drive decision-making in your organization.
Conclusion
By applying these modern NetSuite techniques, you can build dynamic dashboards and reports that deliver real-time, role-based insights across your organization. Leveraging tools like SuiteAnalytics Workbook, saved searches, and personalized dashboards allows you to surface the metrics that matter most, uncover trends faster, and support more agile decision-making. As NetSuite continues to advance its analytics capabilities, these tailored reporting strategies ensure stakeholders have clear, actionable visibility, helping your business operate more efficiently, scale effectively, and stay competitive in 2026 and beyond.