In another #AskQueBIT (Drag and Drop Cube Load in Planning Analytics Workspace (PAW)) article, we showed you how to load data to a cube by dragging and dropping a .csv file onto the workspace. The cube that we used is relatively simple, with only 3 dimensions:
- Award Year
- Person
- Award
However, both the Person and the Award dimension also have attributes that can be converted to PAW hierarchies and added to explorations and visualizations in PAW as “virtual dimensions.”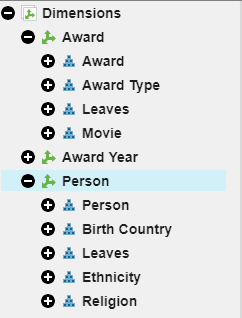
In this article, we’ll show you how to create hierarchies from attributes and use them in PAW for deeper and more precise analysis. We’ll create two hierarchies on the Award dimension (Award Type and Movie) and three hierarchies on the Person dimension (Birth Country, Ethnicity, and Religion).
You can manually create a PAW hierarchy from an attribute by following these steps (check out the GIF below for an example):
- Right-click the dimension and select “Edit Dimension”
- Click the label icon in the upper-right corner to show the attributes
- Right-click the desired attribute and select “Create Hierarchy”
Note: PAW hierarchies can (and should generally) be maintained with TurboIntegrator, especially as PAW hierarchies are not automatically recreated as attributes change.
Once the hierarchies have been created, they can be added to an exploration or visualization in PAW by right-clicking a dimension tile and selecting “Add Related Hierarchy” or “Replace this Hierarchy.”
Check out the short clip below to see it in action and stay tuned for more upcoming articles on PAW hierarchies.