
In any given TM1 model developers make use of attributes in a dimension. These attributes can have a multitude of uses, i.e. driving calculations or serve as reference in a report or sometimes they drive hierarchy structures and many others.
The use case we will discuss in this instance is the use of attributes to create dynamic subtotals in a dynamic report using Planning Analytics for Excel (PAx). We assume in this example that these attributes don’t exist as a hierarchy in the dimension, and one will not be created for us (there are many reasons for not converting an attribute into a hierarchy, but that’s a discussion beyond the purpose of this post).
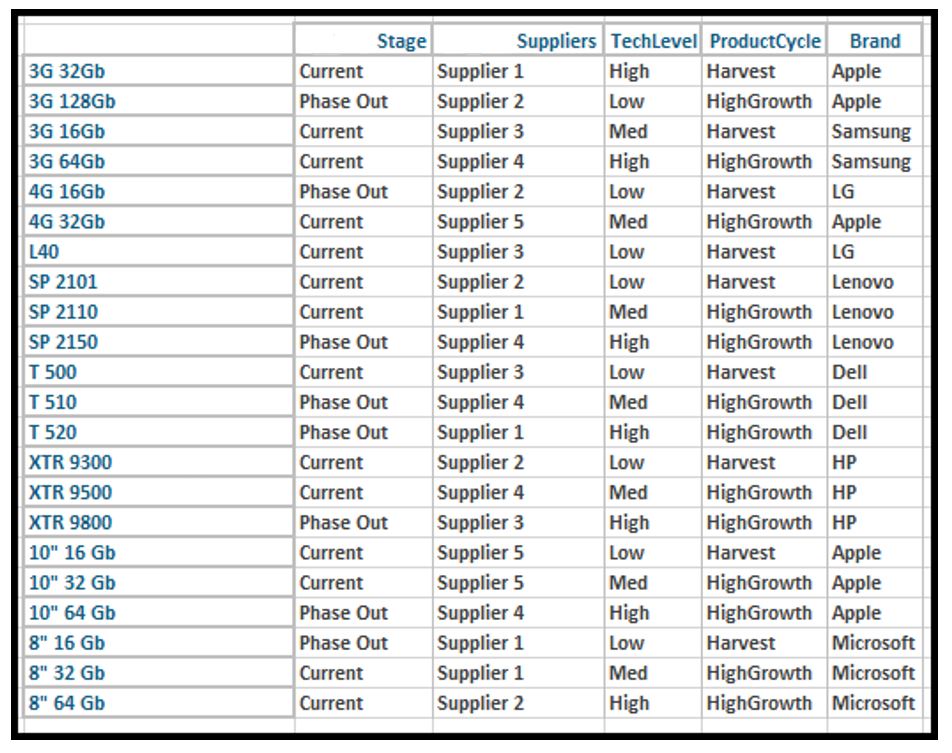
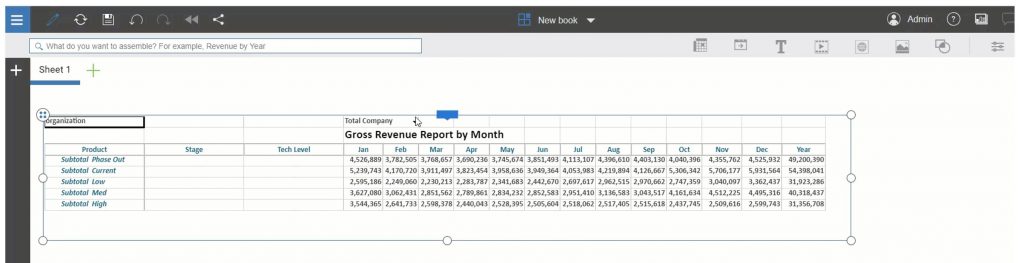
The request is a dynamic report that shows revenue by two attributes in the product dimension. The product dimension in this example contains elements which represent electronic products (Phones, PCs, Tablets). The products have an attribute called Stage, which indicates if it’s Current or Phased Out. There is another attribute called TechLevel that flags it as High, Medium or Low.
The only way to accomplish the request, and have a dynamic report, is to work with the Excel data range generated by the dynamic report.
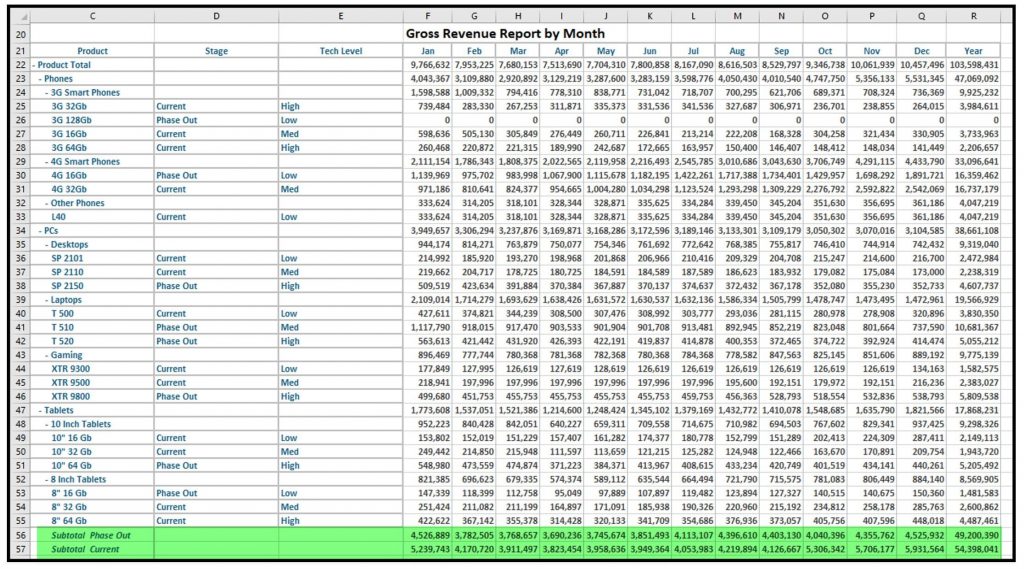
We start with a simple dynamic report of the cube containing our revenue data. In this case the cube is called Revenue. The rows will contain members of the product dimension and the columns months in the year.
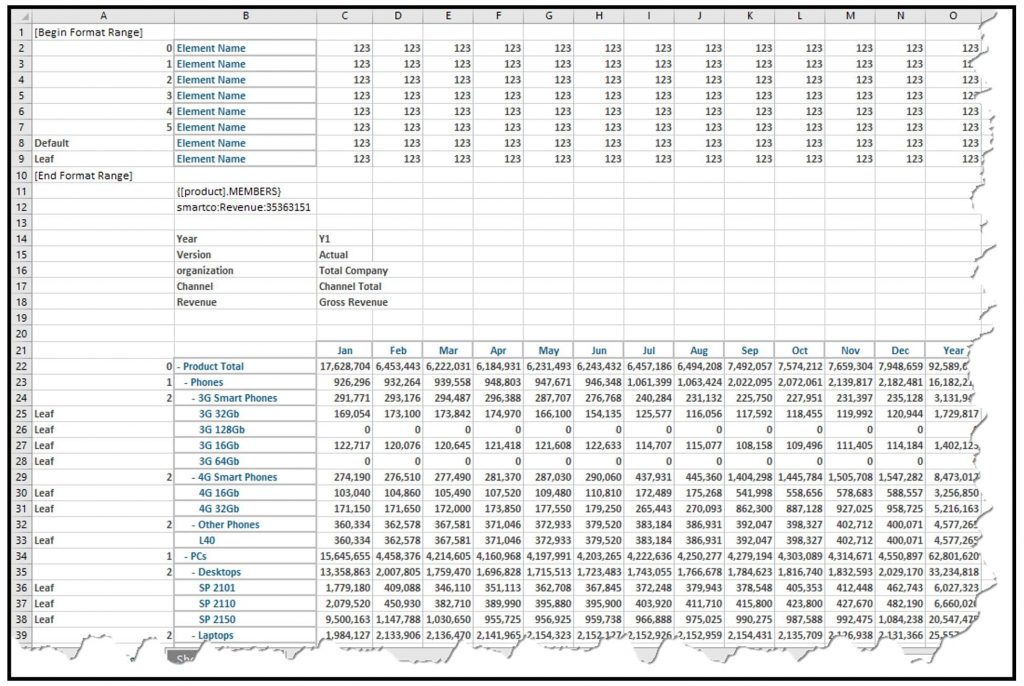
We will need to add the two attributes to the report. We will do this by entering a DBRA formulas in the columns adjacent to the product dimension.

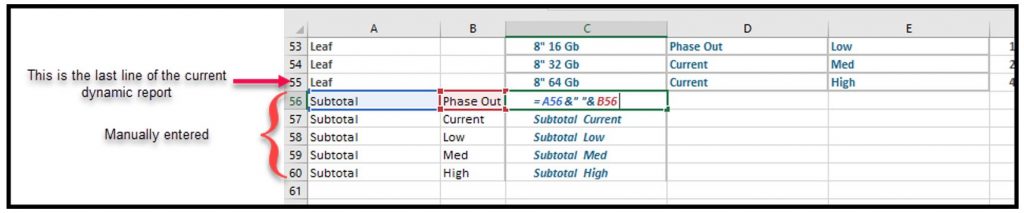
Next, we need to create our sub-totals. Now, because we can’t break the dynamic report, we need to add the sub-totals at the bottom, after the last line of the dynamic report. We will try to make the subtotals a little bit easier to maintain manually, so we will add a column between the format line column A and the product dimension, which are the rows of our report. We will then concatenate the Sub-total row title. Hopefully, this will make it a little easier if we need to add new categories in the future.
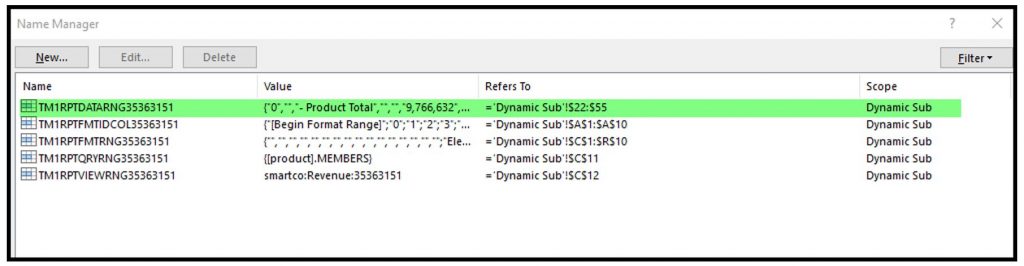
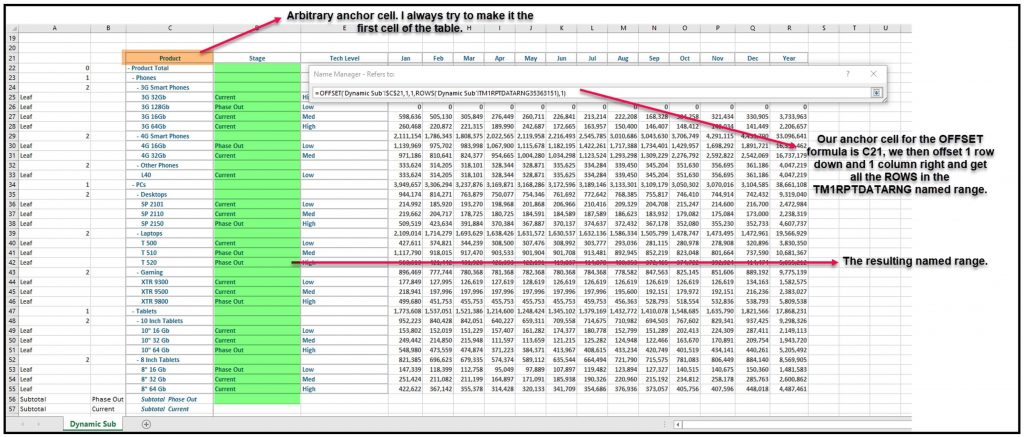
We now get to the meat of the exercise and need to create a couple of Excel named ranges. We will use both the Excel OFFSET and ROWS formulae in conjunction and leverage the data named range that’s automatically generated by PAx’s dynamic report. So, we go to the Excel’s Named Manager and check the existing ranges.
We create a new named range called Stage, like this:
=OFFSET(‘Dynamic Sub’!$C$21,1,1,ROWS(‘Dynamic Sub’!TM1RPTDATARNG35363151),1)
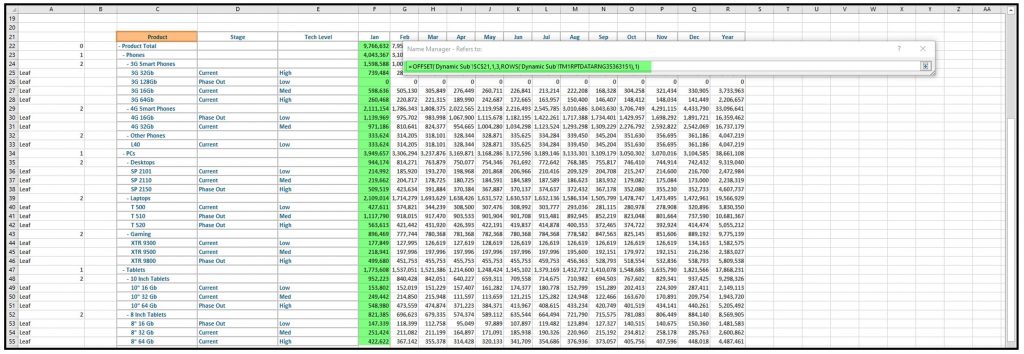
Now, we need to add named ranges for each of the columns we need to calculate. This is where it might get tedious. In the example below we have 12 months, so we need to add 12 named ranges (i.e. Jan thru Dec). I will show the named for Jan below:
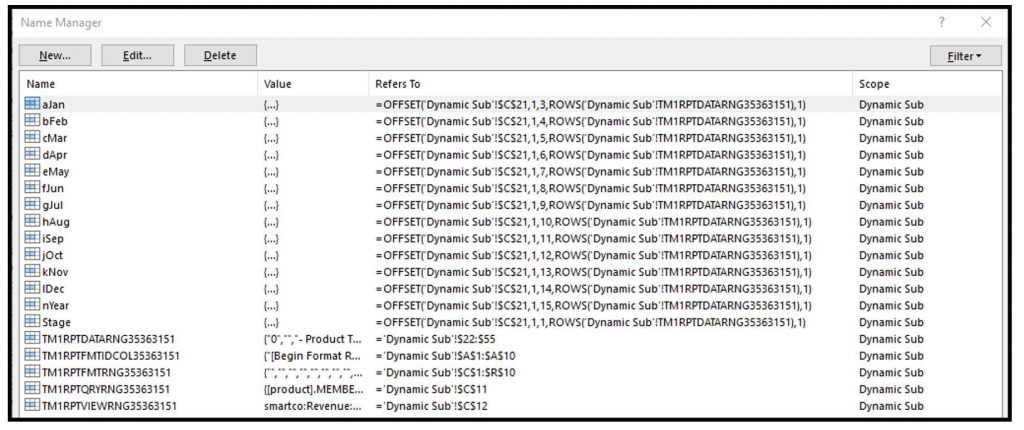
The resulting list of named ranges ( I added a letter to the beginning of the named range so they would show organized in the screenshot):
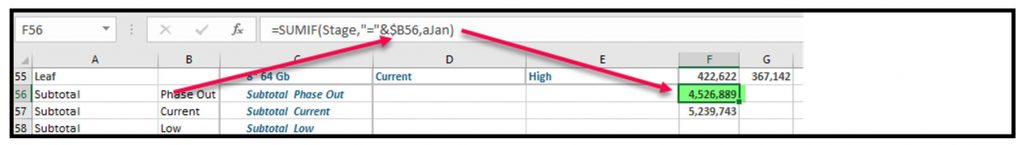
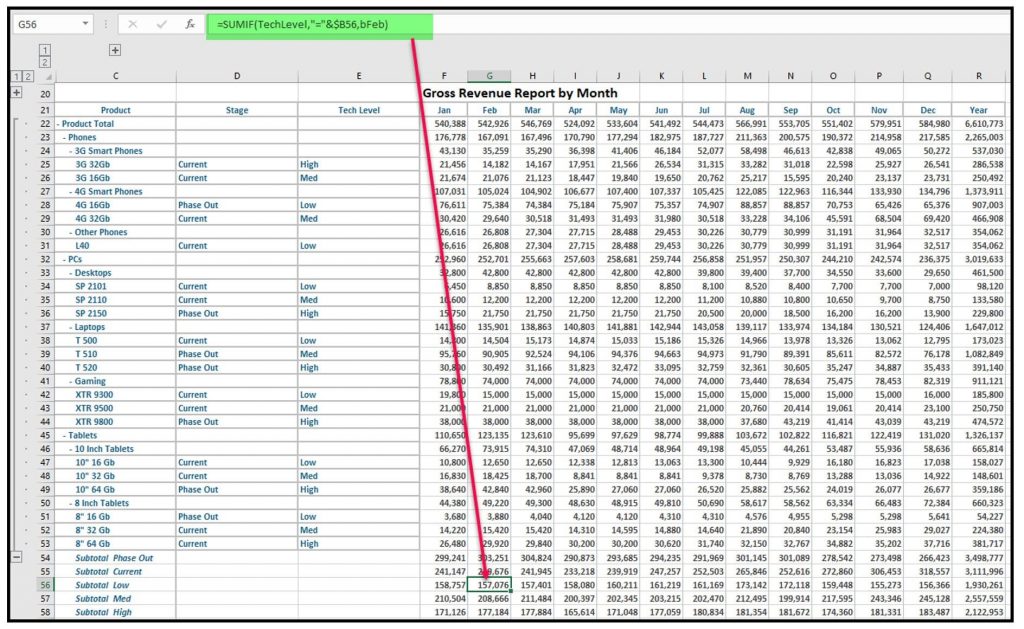
We can now create Excel SUMIF formula for each of our Subtotals at the bottom of the report:
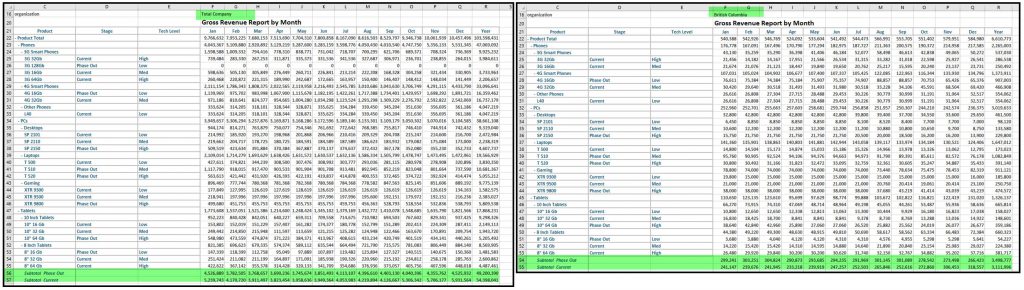
If we filter the data using any dimensional context, the dynamic report will automatically move the subtotal lines as well as sum the correct data. As shown in the comparison below the screenshot on the left shows the context of Total Company, the screenshot on the right shows the context just for British Columbia. We see the number of rows dropped, which caused the subtotals to be shown in line 54 instead of 56 and the subtotals are also different.
We now need to work on the subtotals for Tech Level. We only need to create one more named range, since we already created the named ranges for the months. So, we call the TechLevel named range with this formula:
=OFFSET(‘Dynamic Sub’!$C$21,1,2,ROWS(‘Dynamic Sub’!TM1RPTDATARNG35363151),1)
PAx has a new feature, if you hide columns using Excel’s group function, TM1 will automatically generate a group for the dynamic form. So you can hide the entire dynamic report and only keep the subtotals.
I hide the Format Areas using Excel’s Group function in the Data menu. Next time I change my context, in our example from Total Company to British Columbia, I will see a Group for the dynamic report rows.
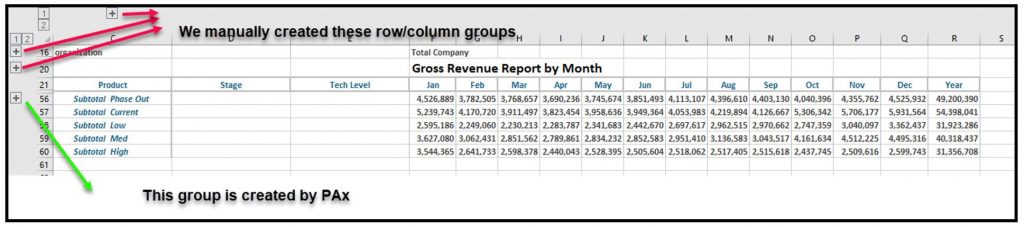
When you look at this on the PAW or TM1web. The report will only display the Subtotal rows.
Save Time and automate your IBM Planning Analytics Reports with ReportWORQ. Request your 30-day commitment free evaluation of ReportWORQ Today!