
How Can I create an Exploration view in PAx (IBM Planning Analytics)? An Exploration View shows data in rows and columns. An Exploration View also has a context area, which you can use to filter the data in the Exploration View. You create an exploration view by clicking the Exploration icon:
Next you can select an existing view from the task pane and drag it onto the exploration object in your worksheet.
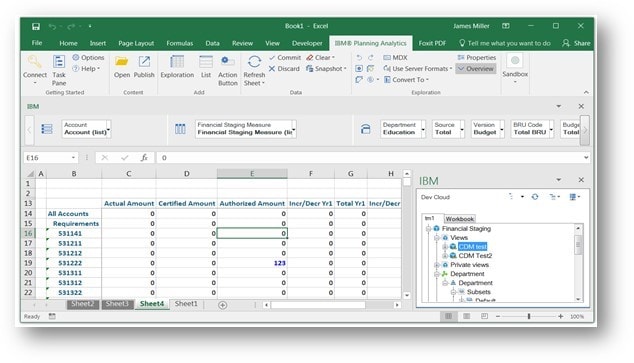
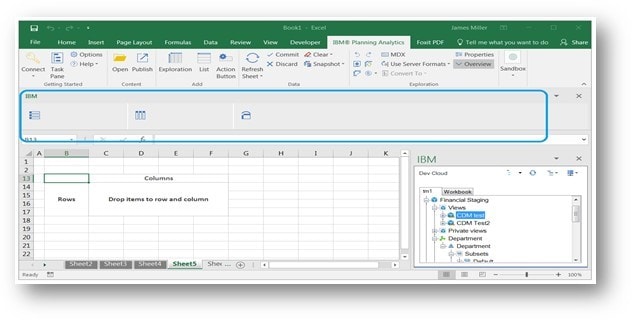
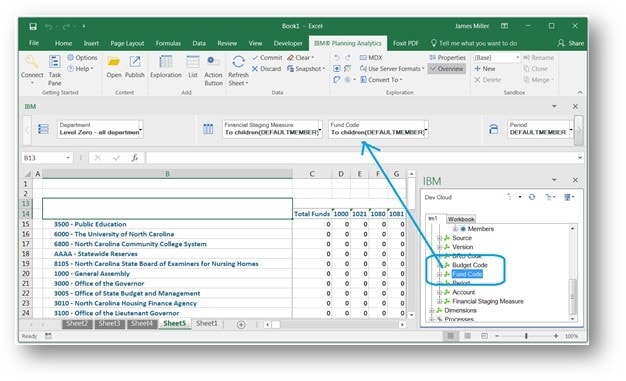
Planning Analytics for Excel (PAx )“builds” your Exploration View for you (shown above) and then you can modify the view (just like you would in the TM1 or Planning Analytics cube viewer). You can also “build from scratch” (rather than selecting an existing view). To do this, you click the Exploration icon and then drag dimension/subsets to the rows and columns (and optionally) context area above the worksheet:
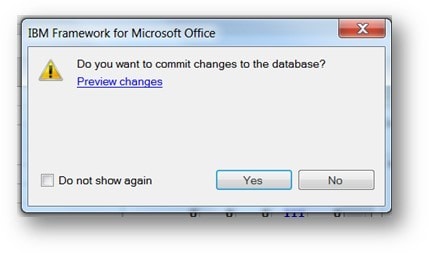
In the exploration view, you can update data (in valid intersections) by entering or updating the data and clicking Commit.

Then select Yes:
Save Time and automate your IBM Planning Analytics Reports with ReportWORQ. Request your 30-day commitment free evaluation of ReportWORQ Today!