
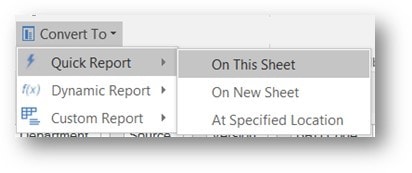
A Quick Report shows data in rows and columns. A context area above the Quick Report shows the context members. You can create a Quick Report from an IBM Cognos TM1 Exploration View after you finish your analysis and want to present data by using more advanced cell-based features from Microsoft Excel. When you convert Exploration Views to Quick Reports the application places the system information, rows, and columns in named ranges. Quick reports are the equivalent to snapshots (they are static and do not maintain a connection to TM1). To create a quick report, you create or open an exploration view and click Convert To then select an option:
————————————————————————
On This Sheet: Converts your view to a static Excel worksheet on the current worksheet.
On New Sheet: Converts your view to a static Excel worksheet on a new worksheet.
At specified Location: Converts your view to a static Excel worksheet and inserts it at a specified range.
————————————————————————
How can I create a Dynamic Report in PAx (Planning Analytics for Excel)?
A Dynamic Report shows data in rows and columns. A context area above the Dynamic Report shows the context members. Dynamic Reports use TM1 functions to define the components of the report, such as context members, row members, and display properties. Dynamic Reports also use formulas to apply formatting to rows automatically. You can create a Dynamic Report from scratch or by converting an Exploration View to a Dynamic Report. Dynamic reports are the same as a slice (they maintain a connection to TM1).
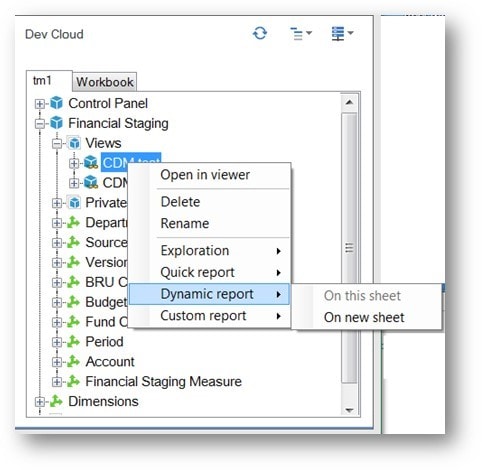
You can create a Dynamic report in the same way as you create a quick report or by right clicking on a view, selecting Dynamic report, then On this sheet or On new sheet:
Save Time and automate your IBM Planning Analytics Reports with ReportWORQ. Request your 30-day commitment free evaluation of ReportWORQ Today!