
What Can a List Header and Footer Do for you in Cognos Analytics 11+
Just make your report look and read great!
I recently had a client who wanted to see summary cost information on Sales Orders at the header of the page, with details available in a list report. I tried using singleton’s and groupings, but all the totals were buried within the report and it was difficult to read. A colleague suggested I use a “List Header and Footer”. Wow, was I impressed with the results. It was so easy to implement, and the report looked great.
Business Case:
The City of Boston currently utilizes a “311 System”, which enables city residents or city workers to easily report non-emergency issues. Items such as broken streetlights or graffiti can be reported to the proper city services department via mobile phone applications, online, social media or a phone call. For this example, we would like to create a list report which will show the total count of issues and the average days to resolution by neighborhood.
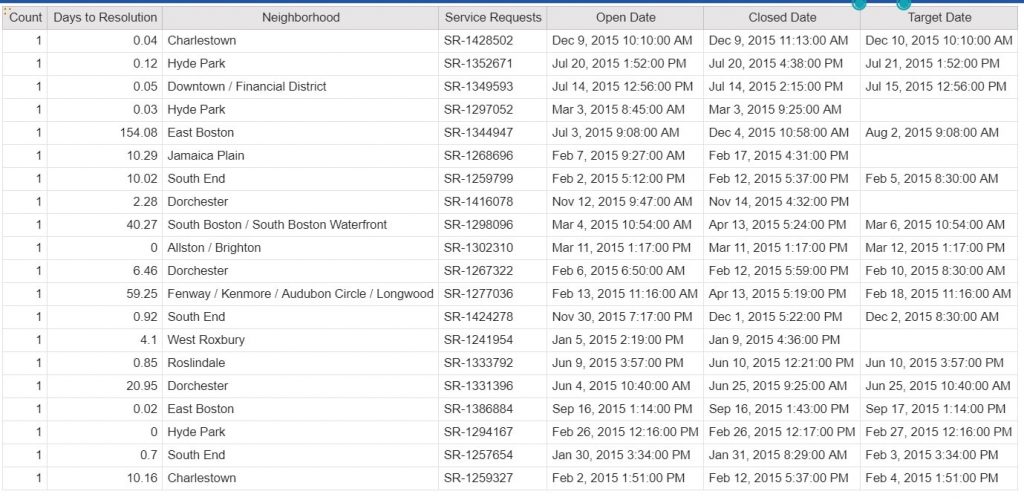
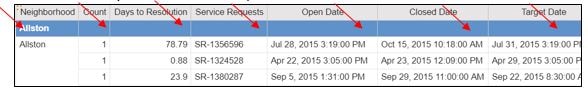
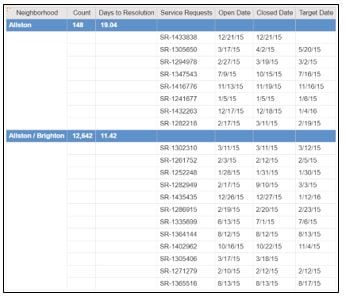
Here is how the data looks when we first start the report. As you can see, we have a very simple list report with no summations. As a consumer of this report, I cannot easily determine total count of issues or the average days to resolution by neighborhood.
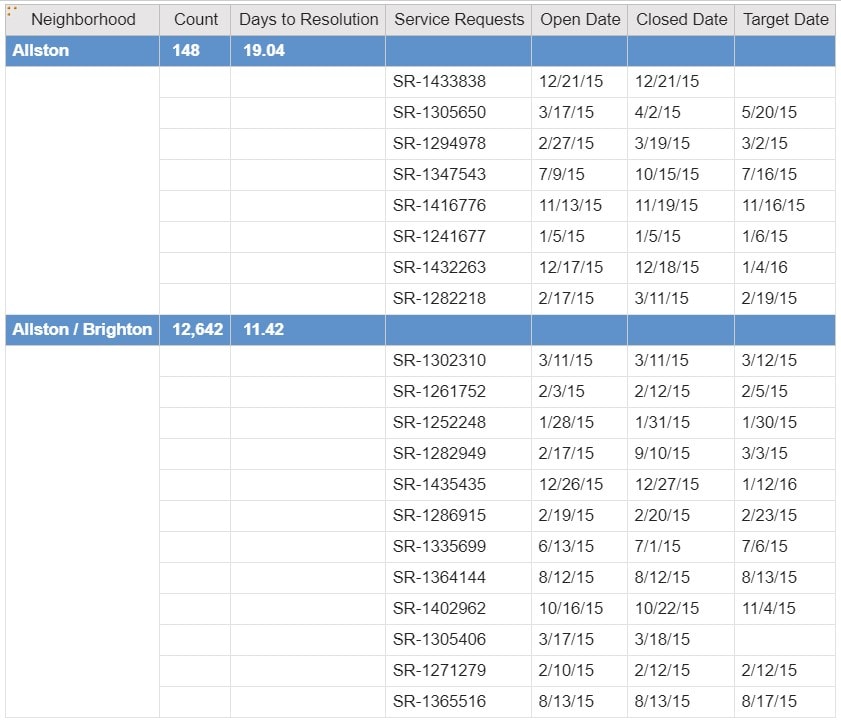
Here is the report when we get done. As you can see, we have the total count and average days to resolution at the top of the list as we desired.
Procedure:
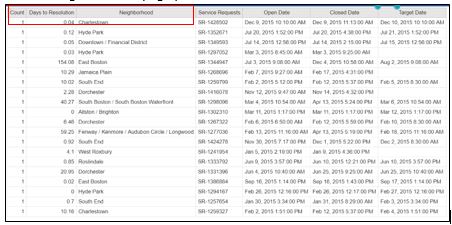
- Create a list report with the fields you will want to show. I suggest you leave the items you want to include in the list header to your left as shown below. Please note, I am making these changes while in page preview mode.
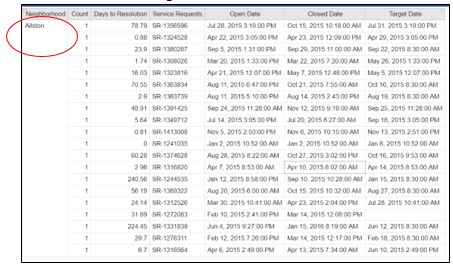
- Highlight the Neighborhood column and click the group icon on the tool bar.

You will now see the Neighborhood column has moved to the left and is grouped.
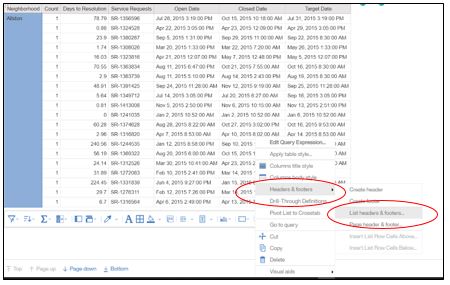
- Again, highlight neighborhood and choose the more icon ( ) on the tool bar. Choose “Headers & Footers” and then “List headers and footers”
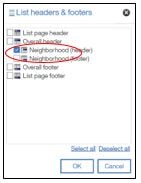
- For this example, we only want to choose header, as we do not need a footer. Only check the box next to Neighborhood (header) and press OK.
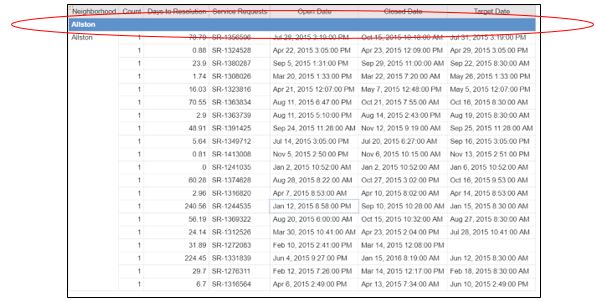
- You will now see a header row has been created within the list.
- It’s now time to format the header row to hold our totals. The first step is to split the cells in the header by clicking on the header and then choose “Split Cell” from the tool bar.
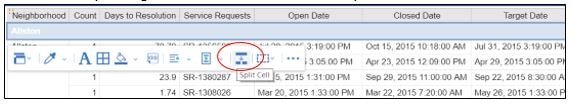
You will now see your header line has split into cells.
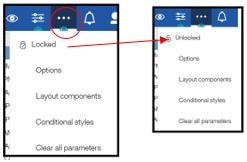
- Unlock the cells in the list by going to the upper righthand corner of the page and pressing the more icon ( ). Then click on “Locked” and you will see the option will now show unlocked.
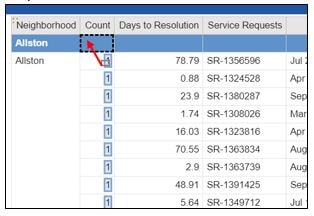
- Under the Count column, highlight the item. You will notice the item itself is highlighted not the column. Drag and drop this to the header row as shown below. Do the same with the “Days to Resolution” item.
You will now notice the summaries are in the header row.
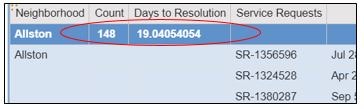
- The final step is to format your dates and numbers, and you have the new report as shown below.
** Tune in for the next KB where I’ll show you how to hide/show the detail on your list!!!