
Have you ever logged into your IBM Planning Analytics environment, seen a number and thought to yourself; I wonder when that was updated? Do you struggle to dig into the log files anytime something odd seems to have happened?
Assuming the data changes occurred due to an automated process rather than manual changes, then building a Process Statistics cube can be a huge help. Process Statistics cubes keep track of what processes have run, who ran them, and how long they took. It also helps you avoid having to go to the log files to find this information which can be time consuming and frustrating.
All you need is to insert some standard TM1 TI (TurboIntegrator) code in all your TI processes to record the information you want to track in the Process Statistics cube each time they run. This note includes TM1 TI code snippets that you can use to do this.
The example in this note aims for simplicity, to introduce the concept. A better, and more maintainable approach in the long run is to turn these code snippets into “Update Process Statistics” TI processes that are called from other TI processes using the EXECUTEPROCESS() function. Introducing modularity makes it easier to maintain and expand the Process Statistics capability without having to edit every single TI process that uses it. If the model uses RunTI and parallel processing, however the separate “Update Process Statistics” TI process may not be possible depending on how many cores/processing is done at once.
DIMENSIONALITY OF PROCESS STATISTICS CUBE

Options 1: Gives the model flexibility to run processes simultaneously or multiple times a day while still capturing everything. Not all models require both Timestamp and Line Item.
Option 2: A simpler model but will only allow each process to be run once per timestamp. This will not work if you run the same process at the same time for different parameters.
It is worth noting that the Timestamp dimension could also be replaced with a Daily Period dimension. This would be more common in Option 1 and allow multiple runs per day using the Line Item dimension. This is often preferred as users find it easier to pick a day and look at everything that ran.
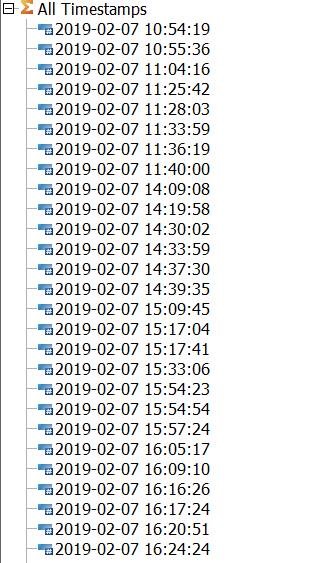
The Timestamp dimension will appear as seen below:
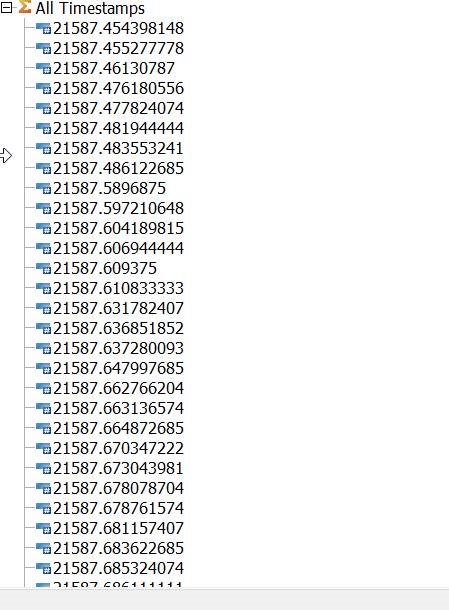
For readability it is worth adding an alias with the data/time in a more legible format. If no more than one run per second you can use the alias below:
[‘Name’] = S: TIMST( NUMBR( !Timestamp ), ‘Y-m-d h:i:s’ );
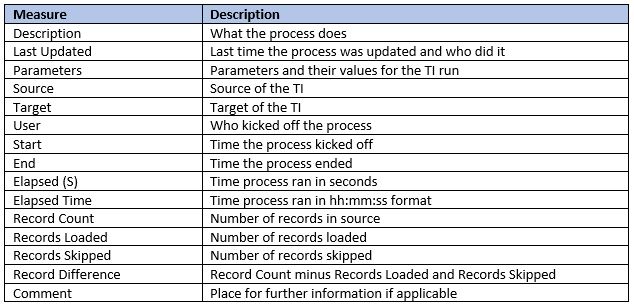
METRICS TO CAPTURE
Below are the metrics we recommend capturing. Some models may benefit from further metrics.
HOW TO GET THIS INFORMATION FROM TI PROCESSES
For the purposes of this instructional note we will use Option 2 above (if interested in Option 1 let us know and we can reach out with further information).
Now that we know what we want to capture from each process we need to add code to send the appropriate information to the Process Statistics cube. The first step is making sure all processes have a boilerplate – this is a small section at the beginning of each process that say what the process does, list its parameters and who updated it last.
Here is an example:
#######################################
# PROCESS NAME:
#
# DESCRIPTION/PURPOSE:
#
# MODIFICATION HISTORY:
#
#######################################
You can use the code below to grab the Description and Last Updated fields. If your processes do not have this, consider adding them for better record keeping and organization.
The rest of the values will have to be calculated along with the appropriate dimension elements.
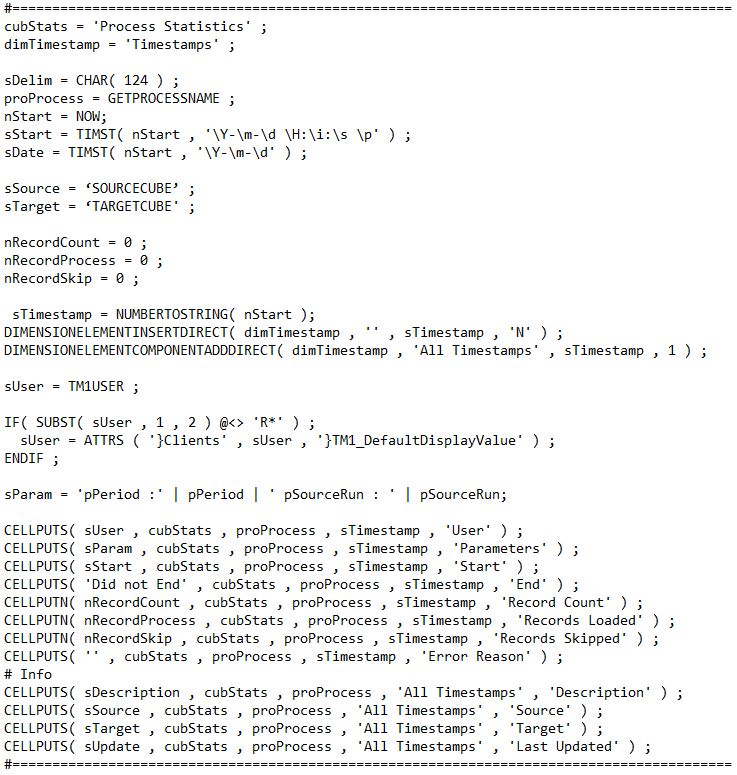
PROLOG
Right under the boilerplate create a section for Process Statistics. Here, the appropriate dimension elements for the Process Statistics cube will be created/determined and most of the Process Statistics information will be sent. (Description, Last Updated, Parameters, Source, Target, User, Start, Timestamp, Line Item).
DATA/METADATA
Here is where all the Record information will be calculated. All the Records were defined as zero on the prolog tab but will be incremented on the Data tab (or Metadata if nothing is happening on the data tab).
The number of times the Data tab is touched is the same as the Record Count. If any lines are skipped (using an ITEMSKIP for example) that is the Records Skipped. The Records Loaded is determined by what is loaded (usually using CELLPUT).
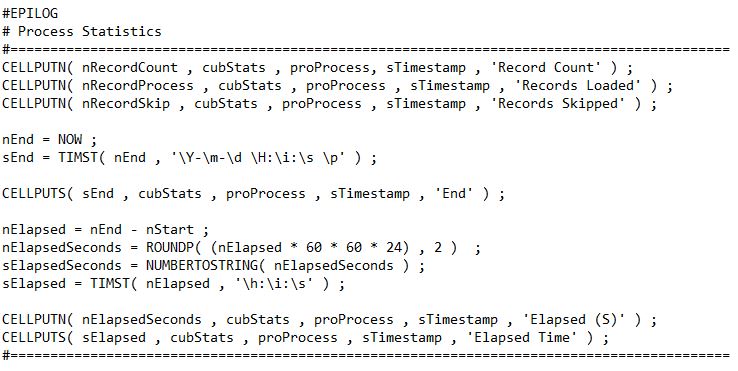
EPILOG
The final step is to send the remaining information to the Process Statistics cube. This includes the Record information calculated in the Data tab and the end time information. This Process Statistics section will need to go at the very end of the Epilog tab to most accurately capture the end time.
Click here to download a TXT file containing these TI script code samples.