
IBM Planning Analytics (PA) subsets can be made dynamic by using multi-dimensional expressions (MDX). Doing so allows for automation and will ensure that subsets update if the dimension changes. MDX allows for many different use cases such as filtering by attributes, levels or using a wildcard search to display all elements that meet a specific naming pattern.
For example, below is a cube view that references a dynamic subset of periods that changes based on the version selected in the view. When the Version element selected is “Draft”, 2022 periods are shown because the “Year” attribute for “Draft” is populated to “2022”. The MDX statement on the Periods dimension will look to equal the string value of the “Year” attribute for the version element selected. When a user changes the Version element to “Budget”, periods from 2023 appear.
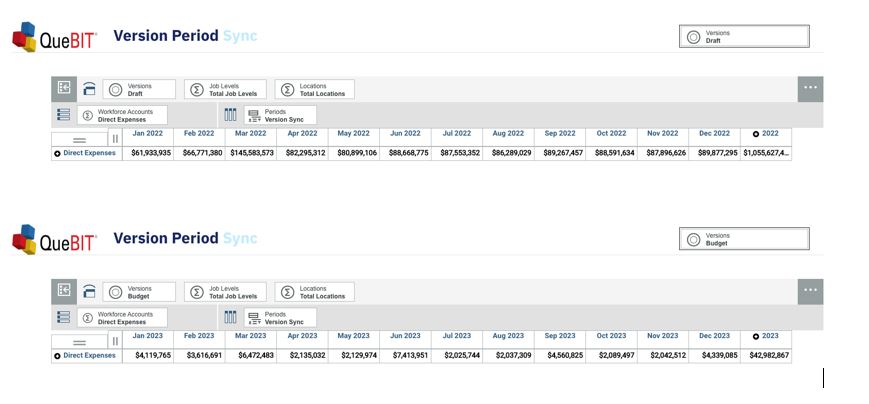
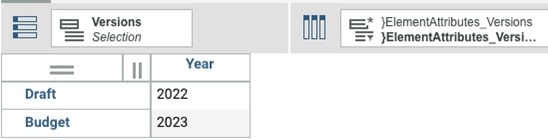
To link the two dimensions of Versions and Periods in this view, an attribute was created on the Versions dimension called “Year”. Each version has an associated year such as Draft being 2022, Budget being 2023 etc.:
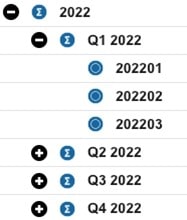
In the Periods dimension, we have a rollup of “All Time” that’s the parent of all years. The leaf elements are months that roll up to quarters which rollup to years. The first screenshot here shows the elements of “2022” without the alias on to give insight into the Periods dimension structure.
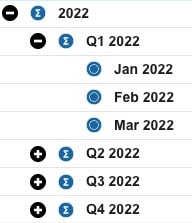
With the alias on, the 3 leaf elements appear like this:
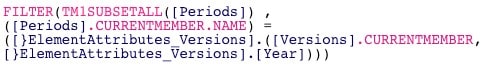
The below MDX tell us to filter the periods dimension for where the current member selected from the Periods dimension is equal to the “Year” attribute of the current member selected from the Version dimension. Please note, the “.CURRENTMEMBER” function is only useful in a subset used to manipulate a cube view because it depends on an element within the cube view to be populated. The MDX below would only return one element, being the year. For example, if “Draft” were chosen in our cube view, we’d see the element “2022”. But if we change our Version dimension selection to “Budget”, our period would update to “2023”.
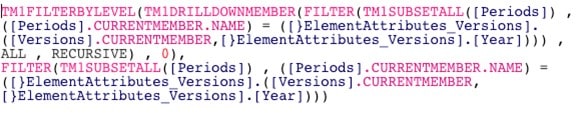
To further develop the MDX, we can wrap a TM1DRILLDOWNMEMBER function around the above statement to expand the “2022” element. When developing MDX, we do a lot of “wrapping” to add complexity because we are nesting set expressions within functions to return new set expressions. Therefore, it’s often helpful to read MDX from the inside out, to see the layers of added expressions. With the TM1DRILLDOWNMEMBER function in place, we now have the year, quarters, and months of “2022”. Wrapping a FILTERBYLEVEL ( <<subset>>, 0) around the subset returned by this MDX expression will return only the leaf-level elements, which are the months of “2022”.
Lastly, we add a comma after the expression that returns our month and the entire above expression to give us the year. We can use commas in between each final MDX expression to return both expressions’ products within the same subset. Our final dynamic subset is the 12 months of a given year followed by the year itself.
We now have a cube view that automatically changes periods based on version selected. This trick can be powerful to develop a user-friendly User Interface (UI). From a user standpoint, this will save extra clicks and adjustments of the cube view but still allows the user the ability to adjust the periods dimension without depending on version if needed. Also, the dynamically changing cube view can help create a more robust UI in general. Now, instead of having separate UIs for Draft and Budget planning, we can utilize one UI which is ideal for maintenance and management.
Interested in Learning More?
Are you interested in finding out more about how to use MDX in Planning Analytics? Then Contact QueBIT today and we’ll be happy to introduce you to the language itself and its clever abilities!