
In an earlier post, we mentioned how IBM Planning Analytics Administration includes the ability to monitor and administer your databases, as well as your host environment, from the Planning Analytics Monitoring dashboard (as long as you have administrator access to use the dashboard).
Note: This particular functionality is available in both local/on premise installations as well those in the IBM Cloud.
As a reminder, you access the dashboard by navigating to your Planning Analytics home page, logging in and then clicking on Administration and then Databases:

The Analytics Monitoring dashboard lists the databases available on your “system”, along with important performance metrics for each database. Each database will appear in the dashboard as an individual “tile”. In the below sample we see there are four databases residing on this host:
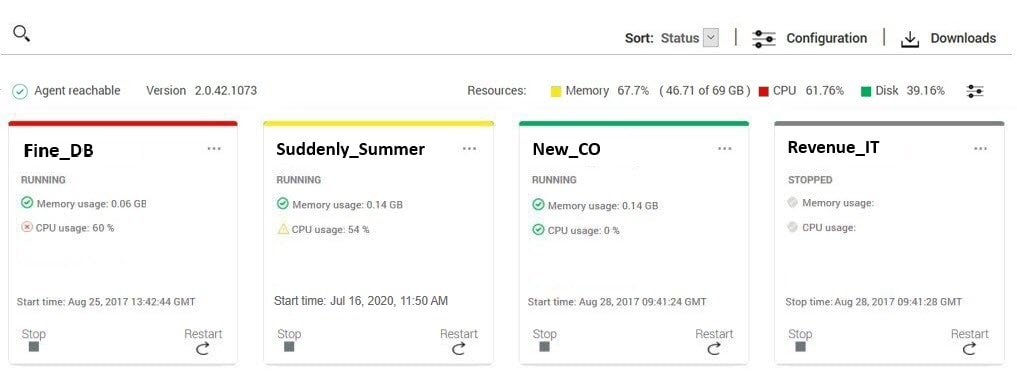
You can organize the database tiles by status or database name (by selecting from the drop-down selector next to “sort”).
When you sort by status, databases in a critical state appear first, followed by those in a “concern” state, followed by safe databases, with “stopped” (not available) databases appearing last. Sorting by name shows all databases in alphabetical order regardless of status.
Notice on each database, there is a Start time or Stop time. This is the most recent database start or stop initiated directly through the Planning Analytics Monitoring dashboard. It is important to note that if a database is started or stopped in any other way (for example through IBM Cognos Configuration) those times are not reported.
You should make a habit of using the dashboard to start, stop and restart your databases. To do this, simply:
- Click Run to start a database.
- Click Stop to stop a database (you’ll need to then click Stop again when you’re prompted).
- Click Restart to stop and then restart a database (you’ll need to click Restart again when you’re prompted).
Take note that depending upon various factors, it may take a few minutes (or longer) for a database to stop completely or startup and be available to log in.
At A Glance
The dashboard is designed to provide a visual hint of the health of your databases with just a quick glance. For example, based upon the status of the database as well as the thresholds set, the color of the top of each database tile will indicate its current state.
Any database that is stopped appears with a gray bar at the top of the database tile, those databases in a “critical state” will have a red bar (at the top of the tile), those in a “concerning state” will have a yellow bar and, those databases currently below the safe threshold will appear with a green bar.
In addition, within each database time, you will see the status (running or stopped) as well as the current memory and CPU consumption. Icons are also used to “quickly gauge” the use of these resources within the database.
If either of these resources meets or exceeds the Critical threshold value, it is identified with a red “x” icon and the entire database is considered to be in a critical state. If memory or CPU consumption falls within the Concern threshold range, then the metric is identified with a yellow “!” icon. If one resource is in a concern state (and no resources are in a critical state), the database is considered to be in a state of concern. Finally, when memory or CPU consumption are at or below the Safe threshold value, they are identified with a green check mark icon. When both memory and CPU are in a “safe” state, the entire database is considered to be in a safe state.
Configuring Frequency
You have the ability to adjust the frequency in which the database statuses are checked and reported. From the Analytics Monitoring dashboard, you can click Configuration:

By clicking on Configuration, you access the Configuration settings dialog (shown below) where you can change the TM1 database status value and click Apply (or click Cancel to exit the dialog without making a change).
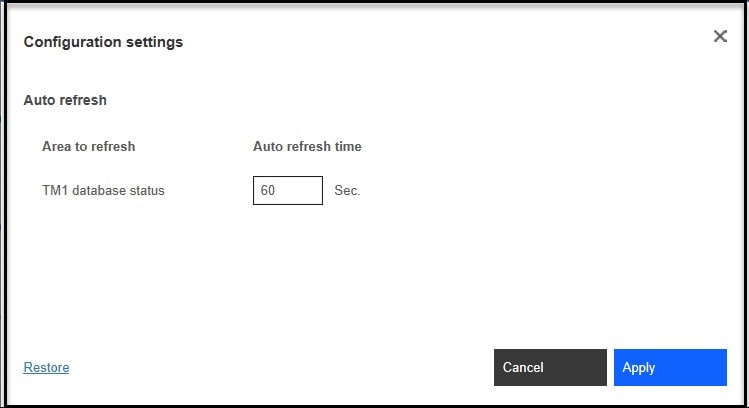
Typically, unless there is a specific reason, the default setting (60 seconds, which is also the minimum) is fine for the refresh interval, but you can experiment with longer refresh times to perhaps better fit your scenario. Clicking on Restore will always reset the interval back to the default.
Drill it Down
You can click the database name on an individual tile of any running database to view a detailed report of the current database state. In the next blog post, I will explore the features and use of this report.
Ask QueBIT
Want more information? Have a specific question? You can always reach out to QueBIT at support@quebit.com for assistance. We’re here to help!