
What’s in a SUBNM?
If you’re learning to build Excel based reports in IBM Planning Analytics, it’s important to understand the core FUNCTIONS and features that drive the report. Several of these functions can be customized to provide flexibility in both format and content. (i.e. TM1RPTVIEW, TM1RPTROW, SUBNM, MDX)
Today, we will focus on the SUBNM function.
The SUBNM function can be used in Dynamic Reports to create parameters that filter the results. For example, you may build an Income Statement to filter by Department or Year (assuming that Department and Period are dimensions in your Financial Reporting cube).
In the exercise below, we will use the TM1RPTROW and the SUBNM functions to view the Periods dimension and its associated attributes.
- Let’s start by creating a Dynamic Report against your Periods attribute cube.
- Since an attribute cube only has only 2 dimensions, which are likely displayed in Columns and Rows, no SUBNM formulas are inherently present in the initial report creation. (Note: In cubes with more than 2 dimensions, any dimension not displayed on the rows or columns will automatically be represented by a SUBNM function.)
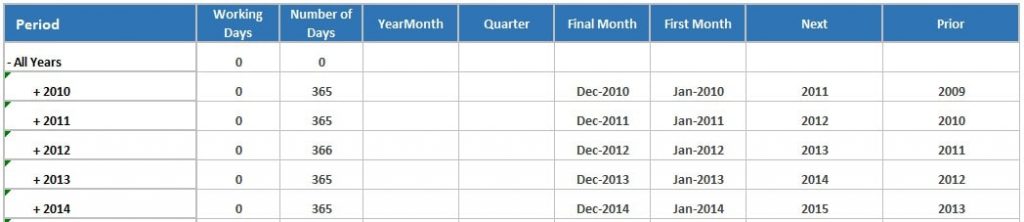
- Notice our Periods dimension displays all Years in the rows based on the cube view we used.
- Let’s add a SUBNM formula to limit the results to a specific Year.
- Insert a row above your report display range and create a SUBNM formula using the following syntax:
![]()
- The DIMENSION parameter must include the Planning Analytics Server Name, followed by a colon and the Dimension name.
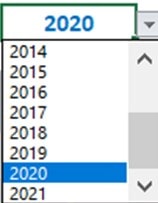
- SUBSET is the name of the subset within the Periods dimension that you would like to display as your “selection” list. In our case, the subset name is “Years”.
- INDEXORNAME allows you to set the default selection that displays when the report opens. NAME will select a specific named element, like “2020”. INDEX will select the corresponding element in the list. For example, if you set the index to 7 based on the subset list shown here, the results will display for 2020”
- ALIAS is an Optional parameter that allows you to choose which alias name displays in the selection list. (i.e. you may have an alternate description/alias for the Period that you prefer, such as “Jan-2020” vs. “202001”)
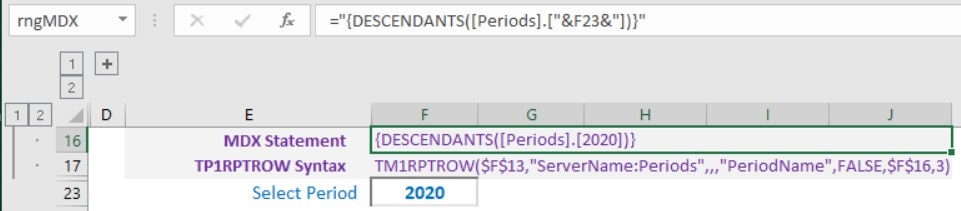
- Create an MDX statement and reference the SUBNM to create a dynamic row filter and link the MDX to your TM1RPTROW function. (This step is not covered in detail in this article as we are focused on the SUBNM).
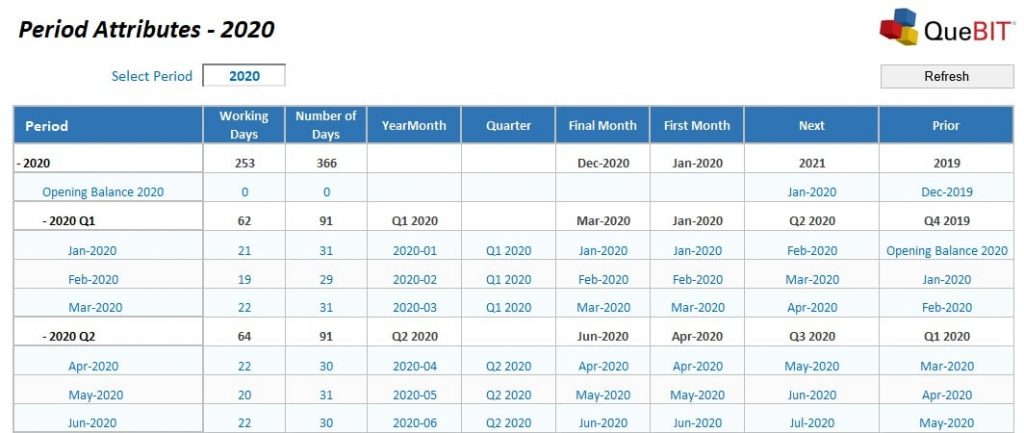
- Finally, make a selection in the SUBNM dropdown and refresh/rebuild the Dynamic Report. Notice your results will reflect a filtered set of rows based on the SUBNM selection.
Contact QueBIT
We hope this article has been informative and helpful.
For more information, please contact QueBIT:
1-800-QUEBIT1
1-800-783-2481