
One of the most common mistakes when designing a report, a view or a visualization of data is to include too much information. Too much information can make it difficult for consumers to formulate “takeaways” and gain insights. IBM Planning Analytics Workspace (PAW) provides an interface rich in options for presenting your data so it’s easy to “overload” a presentation.
Thankfully, PAW makes it easy for you to limit or “hide” what is visible in a presentation. So, suppose that you have an IBM Planning Analytics Workspace View. Which components can you hide? The Row and Column headers? Sheet names? The Overview Area? How about a single data value?
Hiding Rows and Columns
Starting with the basics, you can hide rows and columns that are not needed in your view. This is easily done by any of the following:
- Select the columns or rows that you want to hide, right-click, and select Hide.
- Instead of hiding a member, you can select rows or columns that you want to keep, right-click, and select Keep: all other rows or columns are hidden.
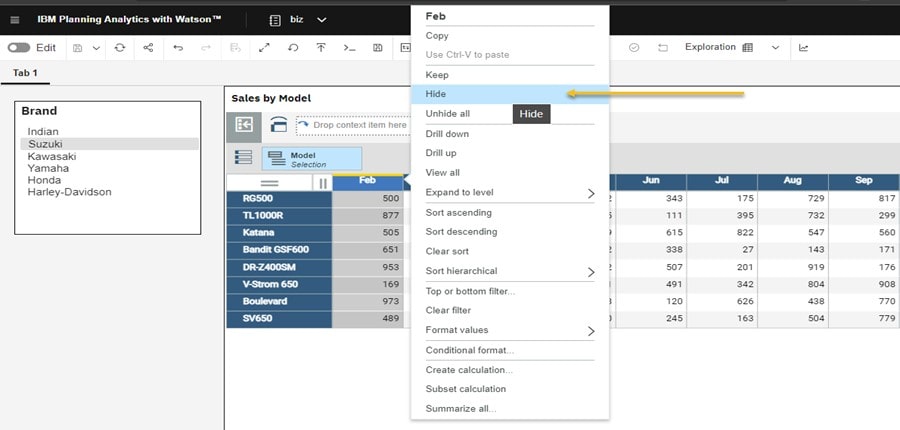
- To (re)show columns or rows that are hidden, right-click and select Unhide all.
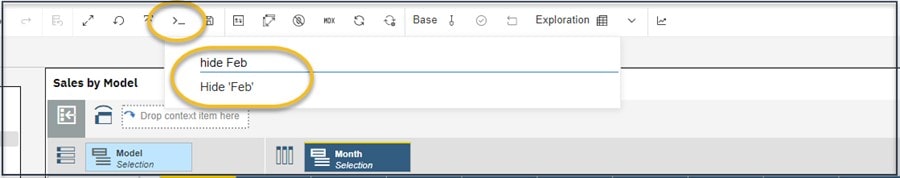
Snap! Don’t forget, for all of the above you can utilize the hide or unhide snap command from the shortcut toolbar. (For example, type hide Feb in the snap command bar).
Hiding Totals
You can also show or hide totals in a view by using the row or column menu, the set editor or snap commands. To use the row or column menu, you right-click either the row selector or the column selector and the select one of the Show Totals options.
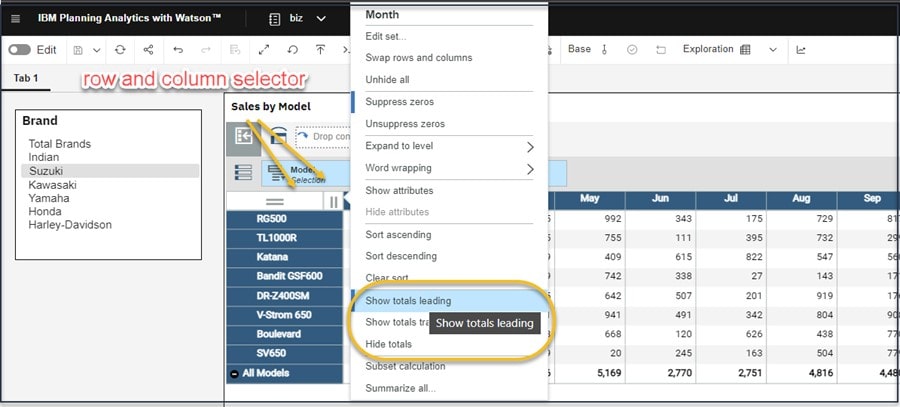
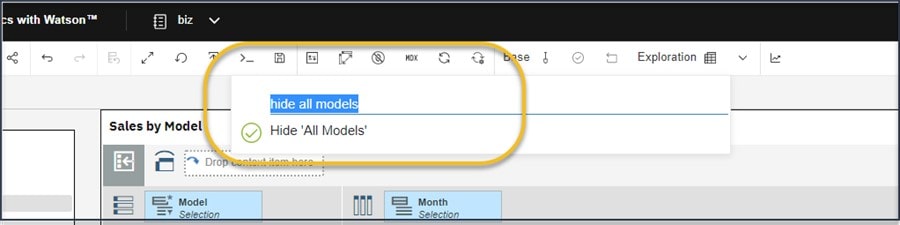
You can also click on the dimension that is showing the totals and use the set editor to “edit the set” and remove or hide the totals line. Note that both approaches also provide you the ability to choose whether totals are leading or trailing to toggle the position of totals. Lastly, you can use the handy snap command line to hide the totals – in this example “all Models”:
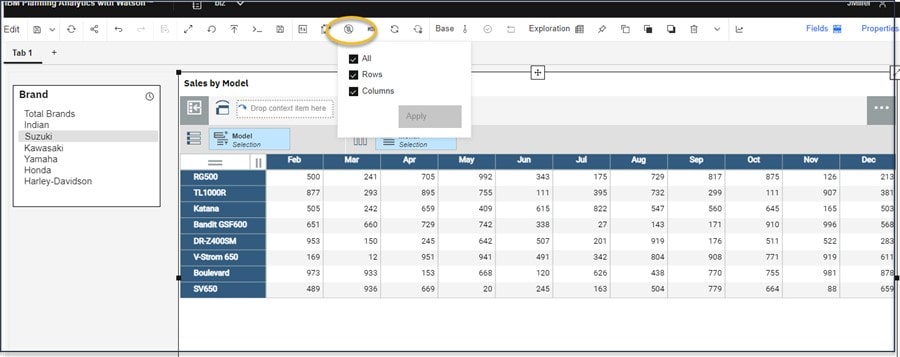
Suppressing Zeros
Of course, probably the “most basic” way to hide rows or columns in a view is by suppressing zeros. That is, if any row or column contains only zeros, you can “turn on” suppress zeros in the view and those rows and/or columns (that contain all zeros) will be hidden. To set suppress zeros, you can click on the shortcut bar:
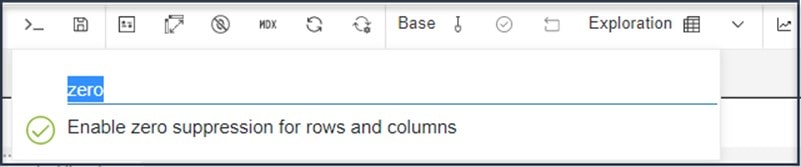
or use the zero snap command:
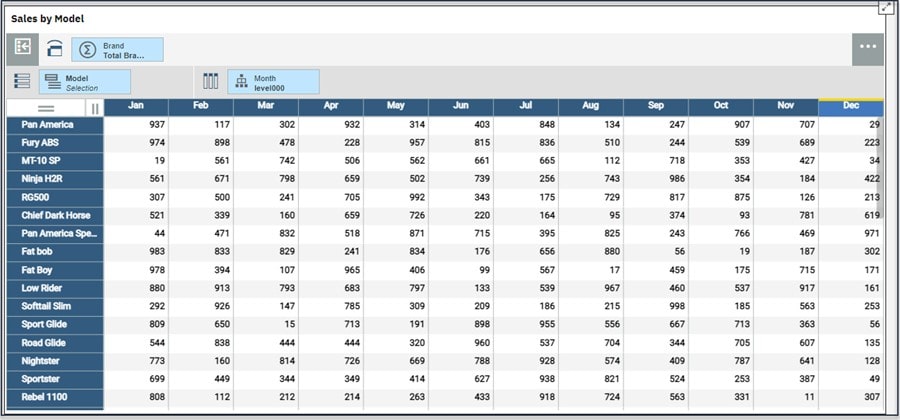
Overview Area
The overview area is a convenient place where you can quickly explore and change the contents of a view. The overview area is separated into the Rows, Columns, and Context areas. You populate the View with data by adding items from the data source to these areas. In the below view I have Models in the rows and Months as the columns. In the context area, I have placed Brands. Each “cell” in the rows, columns, and context area represents a “point” of data in the data source.
If you want to learn more about how to simplify views in IBM Planning Analytics or just have a specific question, contact QueBIT today. We would be happy to discuss your specific questions and further explore the capabilities of PAW.