
In previous blog posts, we discussed the IBM Planning Analytics Monitoring dashboard within Planning Analytics Workspace (PAW) administration, which can be used to track the health of your host environment as well as individual Planning Analytics (TM1) databases. In this post we want to dig deeper into the database activity report and specifically, the usage visualization and threads table which can be used to analyze database usage over time.
Activity within a Planning Analytics database is typically tracked and measured with “threads”.
A thread is a request to the Planning Analytics server to do some work; typically a query such as a user opening a view of data, or it could be a TurboIntegrator process performing some sort of processing, rule calculation refreshes, or even a user logging in, etc. Threads are identified with an ID, Type (user, worker, chore, system) and Name. Thread IDs are system assigned; unique numeric IDs are assigned to each thread. The Thread Name is the actual name of the “user” who initiated the thread (in some cases it may be a Planning Analytics initiated request such as “Pseudo” or other name).
Threads will “pass through” various states, such as Idle, Wait, Running, Commit, Rollback and Login. Each state has a different meaning:
- Idle: An idle thread is not using resources. This may be a user who has successfully logged in but is currently not performing any activity.
- Wait: A waiting thread is, in fact, “waiting” on other threads and cannot complete its work. We say this thread is currently ‘blocked”.
- Running: A running thread is happily performing its request.
- Commit: A thread that is in a “commit” state is one that has just completed an update action (like changing data values) and is now “committing” those updates. In other words, the changes are being “finalized”. Even though a change has been applied to a data value, it is not 100% complete until it is “committed”. Changes applied but not yet committed can be “rolled back” to their original value.
- Rollback: A thread in a rollback state is just that; in the process of “rolling back” to a state before an update or change was applied.
- Login: This thread simply indicates that a user is logging into Planning Analytics.
A “blocked thread” is bad, mostly, because the Planning Analytics server cannot complete the request for some reason and the thread is “waiting”. Typically (hopefully!) blocks eventually “clear” and the thread completes within an acceptable period of time, however in some cases, due to a variety of reasons, blocked threads can cause more threads to become blocked and you’ll have a problem. Some blocking is normal, but if you see an upsurge of “wait” threads or blocked threads becoming more routine, or notice that “wait times” are becoming longer, you have to determine the root cause (QueBIT has plenty of experience in this area and is ready to help – contact us for more information!).
Occasionally you will encounter a thread in a rollback state. This indicates the thread “encountered some sort of conflict” while performing a commit and could not proceed. The thread will automatically “re-try” until the conflict is resolved. Normally, this is a good thing, ensuring that the threads’ work is completed but a “commit-rollback-commit” scenario has the potential to quickly “roadblock” other threads which in turn can impact performance.
Usage Analysis
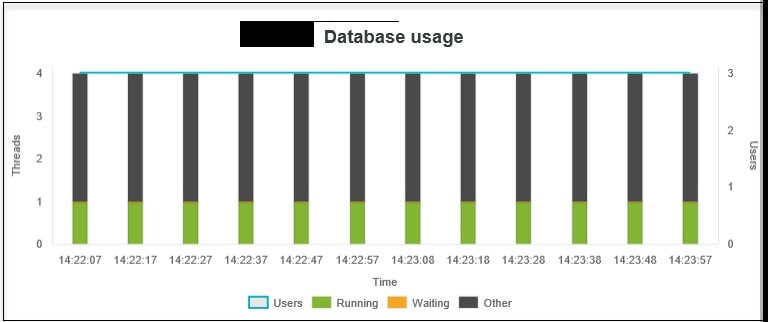
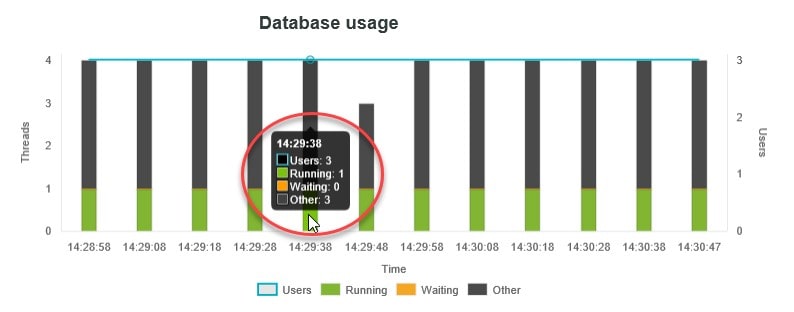
The database activity report provides a “visual summary” of current thread statuses within the Planning Analytics database, showing the number of threads in Running, Waiting, and Other states. The report displays a visualization of thread states as discrete groups over time. At a glance, you can see how activity is trending in your database. Additionally, you can “hover over” any bar on the Database usage visualization to see the details on users and thread states within the selected time.
Detailed Threads Report
Accompanying the database usage visualization, there is a Threads report (example shown below). The report is displayed in a table format showing the details on every thread on the database. This will look familiar to anyone who used the TM1TOP utility with older versions of IBM Planning Analytics or IBM Cognos TM1.
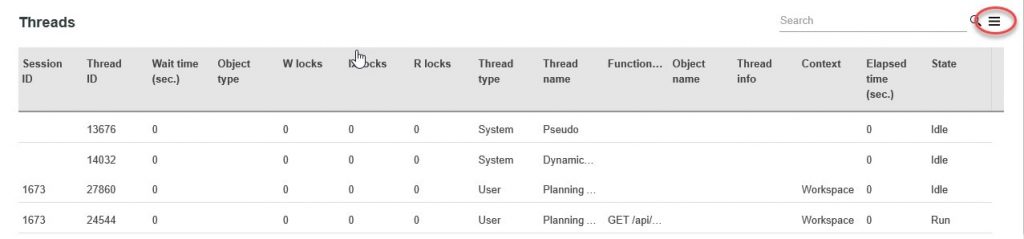
The Threads report includes many insightful data points each displayed as individual columns within the report. You can click on the Manage Columns icon (circled above) to selectively hide or show any of the available columns in the report. Note that your column selections are saved as your preferences for the next time you access and/or refresh the report. Hint: fewer columns selected to be displayed in the report may allow the report to display faster as well as increase readability.
Some of the more interesting or “quick info” data points in this report include:
- Thread ID: the unique numeric ID of the thread.
- State: current thread “state”.
- Elapsed time: indicates the total elapsed time of the thread in its current state.
- Thread info: if a thread is currently blocked, this field displays the ThreadID of the thread that is blocking the waiting thread.
- Wait time: displays the length of time, in seconds, the thread has been in a wait state.
- Thread name: the name of the user who initiated the thread.
Note: You can read the particulars of every column (data point) in the threads report in the “Monitor and manage database activity” section of the IBM Knowledge Center by clicking here.
Actions based upon the Threads Report
In addition to monitoring the current activity (in threads) in your Planning Analytics database, from the Threads report, you can also cancel any non-system thread by right-clicking on any thread, then clicking Cancel thread. You can also disconnect a user by right-clicking any non-system thread and then clicking Disconnect user.
Next Time
Look for some more advanced database monitoring tips in my future blogs.
Ask QueBIT
Are you having trouble understanding your Planning Analytics database activity? The experts at QueBIT are happy to discuss your needs. We’re here to help! Contact us.