
Level-based row indentation is a great way to add quick readability to your Planning Analytics for Excel (PAfE) reports. Instead of having a list of elements all left-aligned, we can add indentation based upon each member’s level to help report readers understand hierarchies within the dimension.
Exploration Views, Quick Reports and Dynamic Reports all have built-in indentation. Therefore, when you slice out your report from the Cube Viewer, your list of elements will have the same row indentation in the Excel report they do in the Cube Viewer.
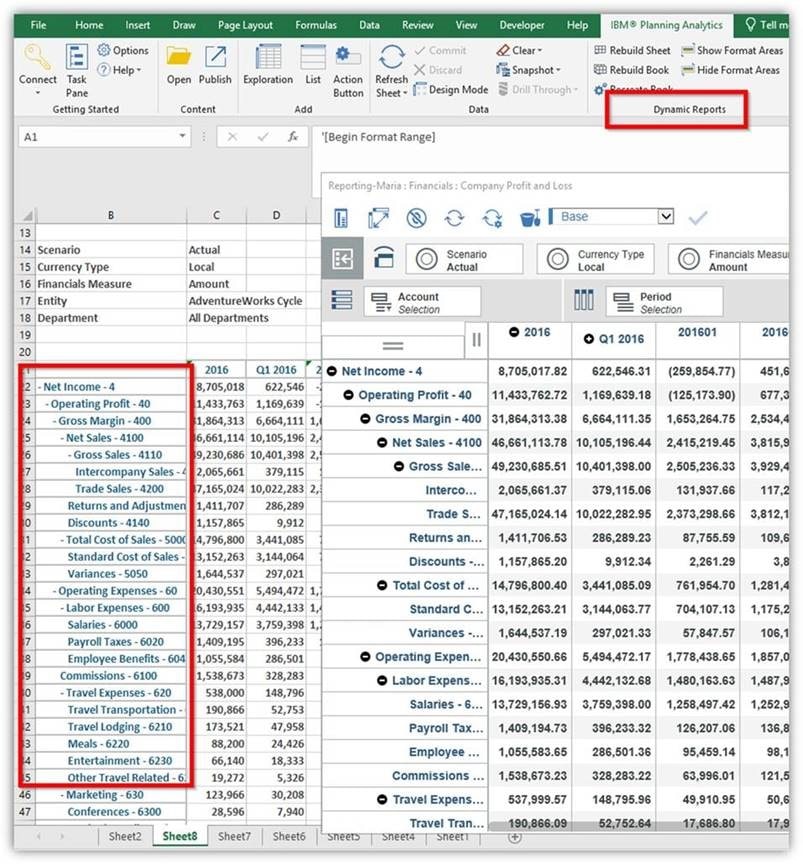
Below is a screen shot which compares row indentation seen in Cube Viewer (on the right) with a sliced our Dynamic Report (on the left):
PAfE users can easily opt to turn on or off any level-based indentation when working with Quick Reports.
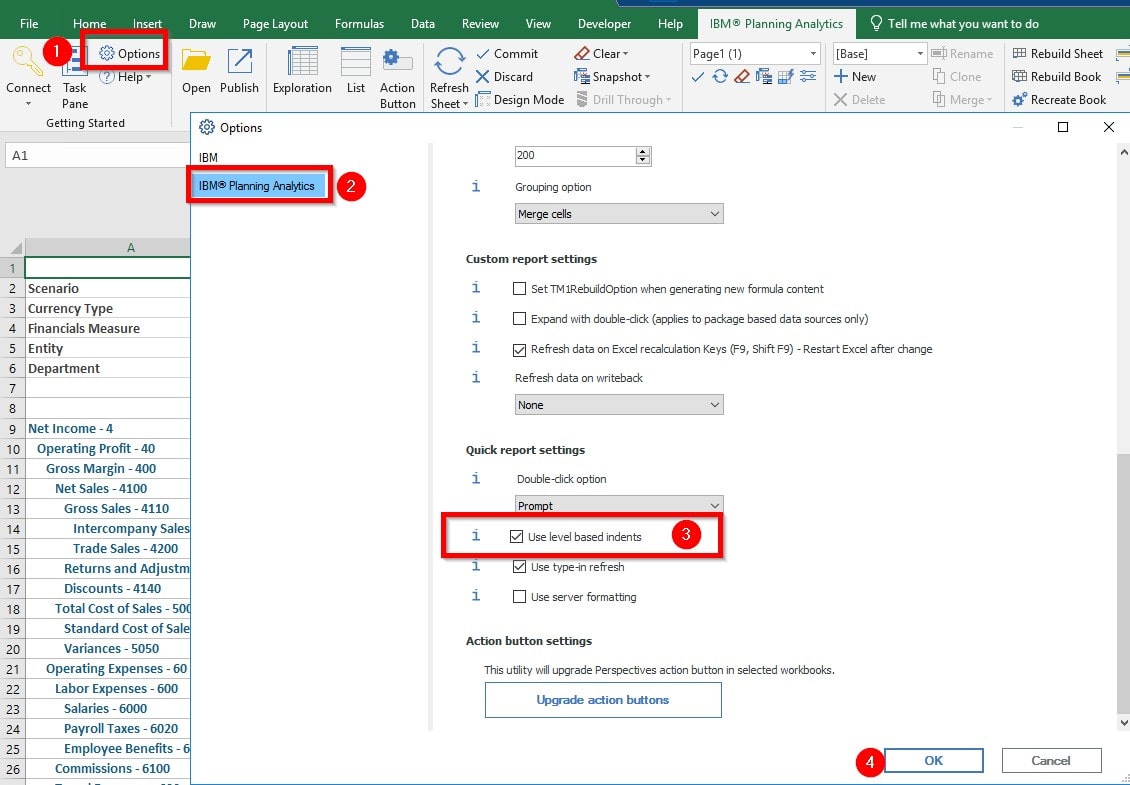
To do so, navigate to the “Options” button, select the “IBM Planning Analytics” tab, then enable/disable the “Use level-based indents” option.
At this time, users only have the option to toggle on/off the indentation for the Quick Reports, not for Exploration Views or Dynamic Reports.
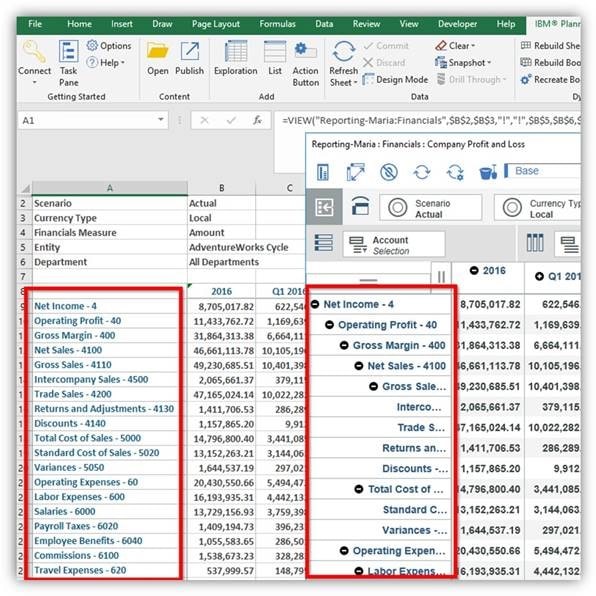
Notice that level-based indentation is not an option for Custom Reports. When slicing out a Custom Report from the Cube Viewer, all elements are left-aligned.
The good news is report builders can create level-based indentation in a Custom Report manually. There are two solutions: one is a “quick” solution, and the other is a more robust solution.
The Quick Solution
- From the Cube Viewer, create two reports: one Custom Report and one Dynamic Report.
- Copy the list of elements from the Dynamic Report and paste them into your Custom Report. The formatting should remain and now your list of elements should have some sort of level-based indentation.
While this solution works, what happens if you need to add an element to this report in the future? Well, for this we can build out a more robust and dynamic solution.
The Dynamic Solution
- Insert two new columns to the left of your report. Columns A & B will be hidden from the end-users, Column C will be the “new” list of elements end-users will see on their report.
- Copy your list of elements over into the new Column A.
- In Column B, we are going to use the ELLEV function to indicate each element’s level.
Here’s the syntax along with my generic example’s syntax.
=ELLEV(“ServerName:DimensionName”, ElementName)
=ELLEV(“Reporting-Maria:Account”, A9)
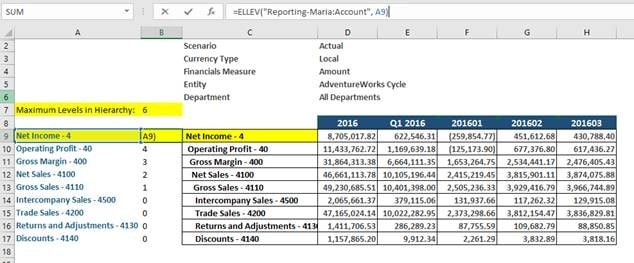
- OPTIONAL: Find the maximum number of levels in your dimension’s hierarchy and use this number to drive the other element’s indentation. To do this, use the DNLEV function.
=DNLEV(“ServerName:DimensionName”)
=DNLEV(“Reporting-Maria:Account”)
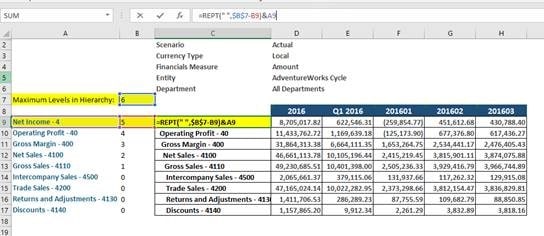
- In column C, you will want to use the REPT formula. Where the argument is for “Total Levels” you do not have to use the maximum levels calculated above. You could instead use the maximum from the list of elements in your report, or hard code this number completely.
=REPT(” “,TotalLevels-ElementLevel)&ElementName
=REPT(” “,$B$7-B9)&A9
In the future, if any more levels are added to the dimension, or a report builder wants to add other elements to this list, then this report will continue inherent the proper level-based indentation.