
An earnings call is one of the most important meetings between the management team of a public company and its external stakeholders. The company prepares internal and external reports like an annual business disclosure report (10-K) every quarter. The typical timeframe for collecting data and producing the earnings-related documents is less than 60 days. That is not a lot of time compared to the amount of data which is in the reports. A public company usually relies on a set of applications to prepare these reports. The applications work together to compile the earnings-call data and generate reports. We will discuss a sample data model which can expedite the report preparation process.
Why is it difficult to collect earnings data from many systems? The reason is that each system has its own protocol and data format. For instance, user data is stored by demographic, spending tier and location while revenue is stored by channel, location, and customer name. We cannot easily combine the two sets of data into one table for the earnings reports. Another potential issue is about the connections between source systems and the application which collects earnings data. If the earnings application does not have a connector or direct link to a source system, a company has to rely on a flat file or a custom-built API connector, which requires maintenance and update. Tracking when the data is refreshed in the earnings model is another potential issue. Without a reliable tracking system, obsolete data can be present in the final reports.
Sample Earnings Model
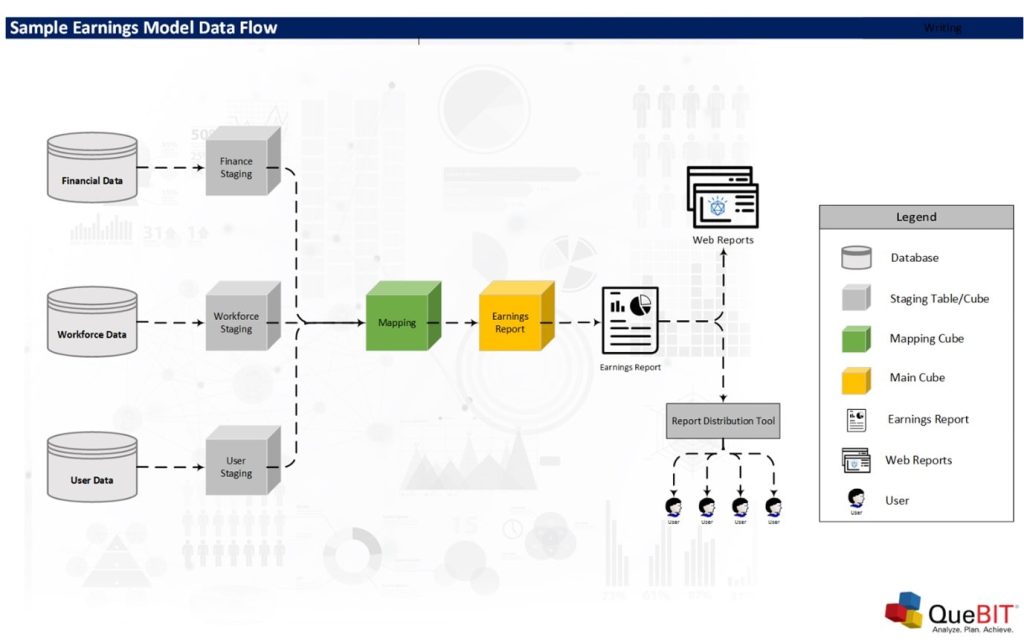
A good earnings model must provide the flexibility to pull data from any source systems and the traceability of the data which is loaded to the earnings model. The above diagram shows a sample earnings model. The diagram starts with the staging tables or cubes on the left of the diagram. These tables store data from different systems. The tables are designed to maintain the data structure in the original systems. This approach provides a great benefit for data validation. If we want to transform data, we will do the transformation before feeding the data into the earnings table. The data flow diagram does not include the data transformation step to simplify the diagram.
After loading data into staging tables, we will map data from the staging tables to the earnings table via the mapping table. The mapping table does not store any earnings data, but it has the mapping data instead. We review the structure of the earnings table before we further discuss the structure of the mapping table. The earnings table is designed to have the similar structure to the earnings reports. The table usually has a small number of columns or dimensions. However, the generic rows in the earnings table allow the model to handle any reports that we want to capture in this earnings model. The columns are also limited to version, period, and measure (hidden in the below screenshot). Please see an example of the earnings table below. We can also add custom and metric calculations, such as a ratio, Quarter over Quarter (Q/Q), and Year over Year (Y/Y), to the earnings table. The data in the earnings table is transferred to different earnings reports. The reports are formatted to meet the requirements of the company while the earnings table supplies the latest data to them.
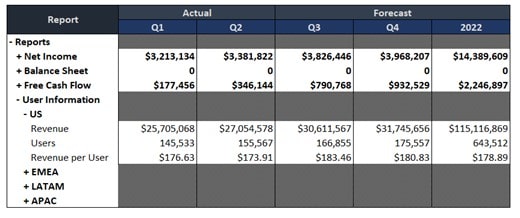
Sample Earnings Table or Cube
The main purpose of the mapping table is to support the processes that transfer data from the staging tables to the earnings table. For example, the mapping information for the US revenue should identify the staging table (Financial Data), channel (All Revenue Channels), location (US), and customer name (All Customers). The load processes may also perform the sum of the data. If the mapping indicates that we want to sum revenue from all customers, the load process will perform the sum before loading data to the earnings table. Additionally, the load process will add a timestamp to the earnings table (by using a measure column/dimension) to record the time of each load. The mapping table also provides the traceability for each line in the earnings table. No data can be loaded to the earnings table without the proper mapping data. If a new line is added to the earnings report, we can simply add new mapping information to the mapping table.
The last part of the earnings model is the dashboard and report distribution tools. We want the report reviewers to review the earnings data in real time. A web report or dashboard tool is one of the best ways to allow many reviewers to look at the earnings data and collaborate. An offline application like a spreadsheet does not work well in this case because an offline report cannot keep up with demand to instantly present new data when it is available. Alternatively, a report distribution tool can be useful if some reviewers do not have access to the web reports and dashboard. However, generating new reports should not require more than a click of a button. Time is a constrain during the report preparation period. We want to automate as many steps as possible to meet the tight deadline of an earnings call.
We have reviewed a sample earnings model in this article. The key features of the model are the speed, the flexibility, and the traceability of the model. However, we have not talked about the applications on which we will build the earnings model. The reason is that an organization can implement this earnings model in many ways using different applications, such as Microsoft SQL Server, Oracle Database, Snowflake, Anaplan, IBM Planning Analytics, and ReportWORQ. It is recommended that an organization starts the model design with the list of features needed for the earnings model before selecting applications. If your organization needs help with the application evaluation, please contact our advisory services team at QueBIT.